Figure 4.
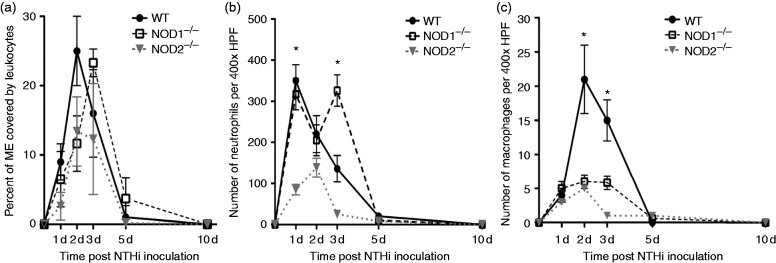
Infiltration of the ME cavity by leukocytes after non-typeable H. influenzae inoculation. (a) Percentage of the ME was occupied by inflammatory cells. Inflammatory cells occupied a greater percentage of the ME in WT mice compared to NOD2−/− mice during the experiment NTHi infection time course. Leukocyte infiltration was substantially delayed in NOD1−/− mice, peaking on d 3 after NTHi inoculation. (b) Leukocyte numbers for neutrophils measured in ME infiltrates in WT and NOD1−/− and NOD2−/− mice. WT mice showed peak neutrophil numbers by d 1 after infection with NTHi that declined by d 5. Neutrophils showed a striking, late influx on d 3 for the NOD1−/− mice. (c) Numbers for macrophages measured in ME infiltrates in WT and NOD1−/−, NOD2−/− mice. Macrophages were recruited to the ME on d 2 and 3 after NTHi infection in WT mice, with few or no macrophages noted on d 5 and 7. Both NOD1−/−, NOD2−/− mice showed significantly reduced numbers of ME macrophages overall (n = 6–8 MEs per time point; bars represent ± SEM; *P < 0.05).

