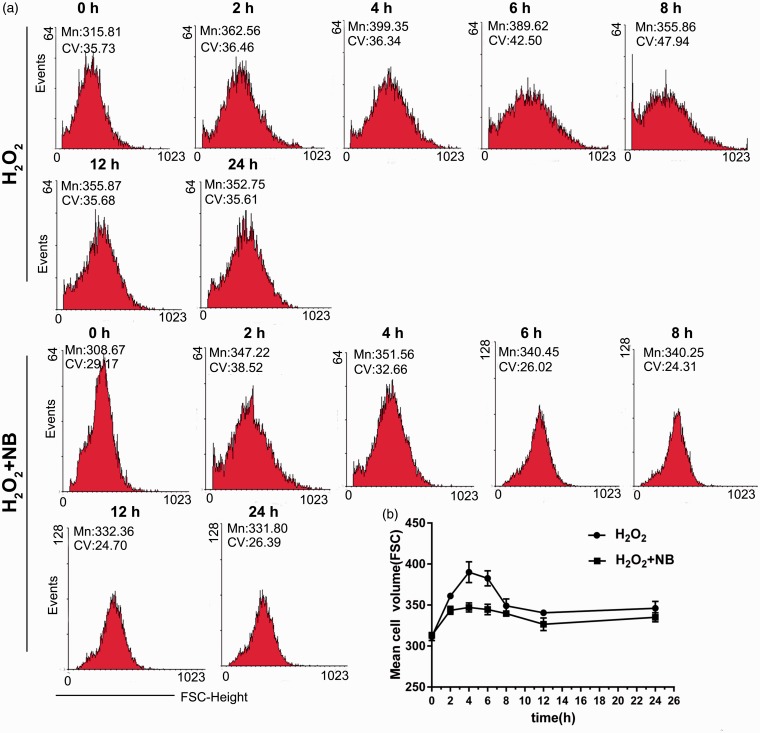
Figure 2.
Effects of NB on H2O2-induced swelling in neuronal cells. (a) HT22 cells were treated with 300 µmol/L H2O2 or H2O2 + NB (100 µmol/L), then cell volume changes were detected at 2 h, 4 h, 6 h, 8 h,12 h, and 24 h, separately. The cell volume changes were detected by flow cytometry using FSC-height and SSC-height; (b) Quantitative analysis of cell volume changes at different time points. (A color version of this figure is available in the online journal.)

