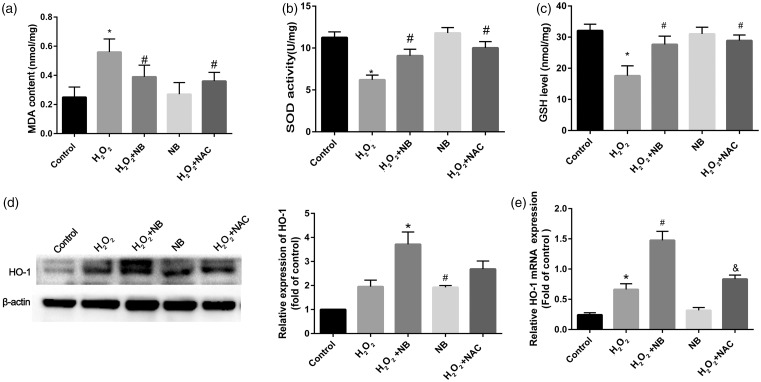
Figure 4.
Effects of NB on oxidative stress in HT22 cells that exposed to H2O2. (a–c) At the termination of the treatment, the cells were lysed and 200 mL of the supernatant were collected for further spectrophotometric analysis of the reaction products of SOD, GSH, and MDA. SOD was detected based on a WST-1 tetrozolium method; GSH levels were indicated based on the reduction of reaction product and MDA was measured based on thiobarbituric acid methods using corresponding commercial kits; (d) HO-1 expression was determined and quantified using Western blot; (e) RT-PCR analysis of HO-1 mRNA. *P < 0.05 vs. control group; #P < 0.05 vs. H2O2 group.

