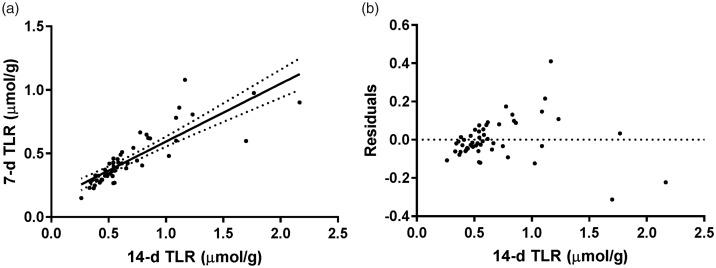
Figure 2.
(a) Linear regression and 95% confidence intervals of total liver vitamin A reserve (TLR) values at 7 and 14 days determined by retinol isotope dilution (n = 52). The slope and y-intercept of the regression were 0.456 (95% CI: 0.374–0.537) and 0.138 (95% CI: 0.0744–0.201). For TBS (data not shown), the slope and y-intercept of the regression of 14-day against 7-day TBS were 0.470 (95% CI: 0.393–0.545) and 120 (95% CI: 66.3–174), respectively. (b) Residuals of the linear regression of 7 and 14 day TLR. The residuals clearly increase as TLR increases (test for homoscedasticity P < 0.0001),26 which was not fully accounted for by analyzing the ratio of the residual to the 14-day TLR instead of the absolute difference (test for homoscedasticity P < 0.05, data not shown).

