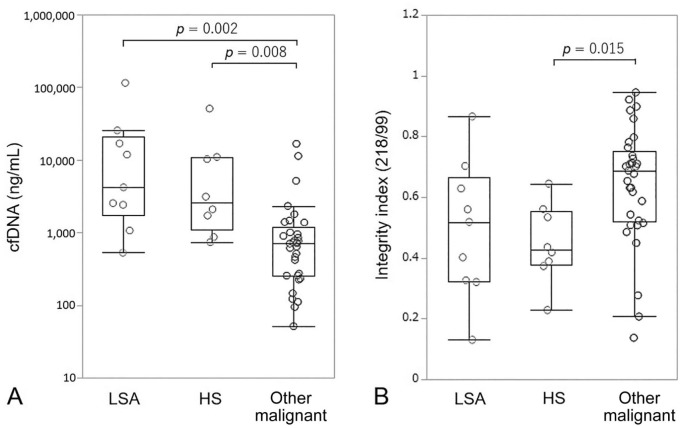
Figure 2.
A. Box-plot of plasma cell-free DNA (cfDNA) concentrations in dogs with lymphoma or leukemia (LSA), hemangiosarcoma (HS), and other malignant tumors. B. cfDNA integrity index. Each box indicates the 25th and 75th percentiles. The horizontal line inside the box indicates the median, and the whiskers indicate the extreme measured values.

