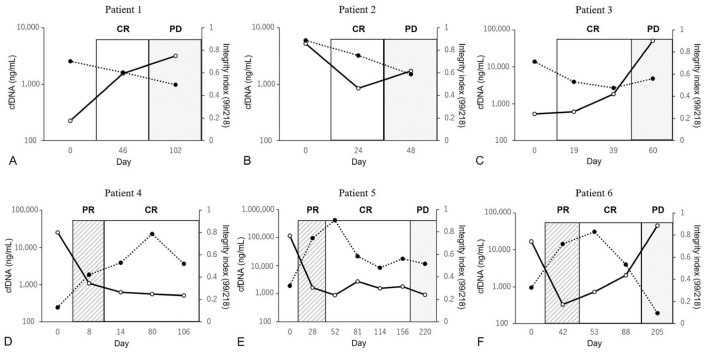
Figure 5.
Comparison of cell-free DNA (cfDNA) and cfDNA integrity index according to treatment response: cfDNA levels (solid line) and the cfDNA integrity index (dotted line) at various time points in 6 patients. The vertical axis on the left represents cfDNA concentration, and the vertical axis on the right represents the cfDNA integrity index. The horizontal axis labels represent the times of plasma-sampling day and tumor status. A. Patient 1, transitional carcinoma of the bladder treated with surgery and cyclooxygenase-2 inhibitor; B. Patient 2, undifferentiated sarcoma treated with surgery; C. Patient 3, splenic hemangiosarcoma treated with surgery and chemotherapy; D. Patient 4, lymphoma treated with chemotherapy; E. Patient 5, lymphoma treated with chemotherapy; F. Patient 6, leukemia treated with chemotherapy. CR = complete response; PD = progressive disease; PR = partial response.

