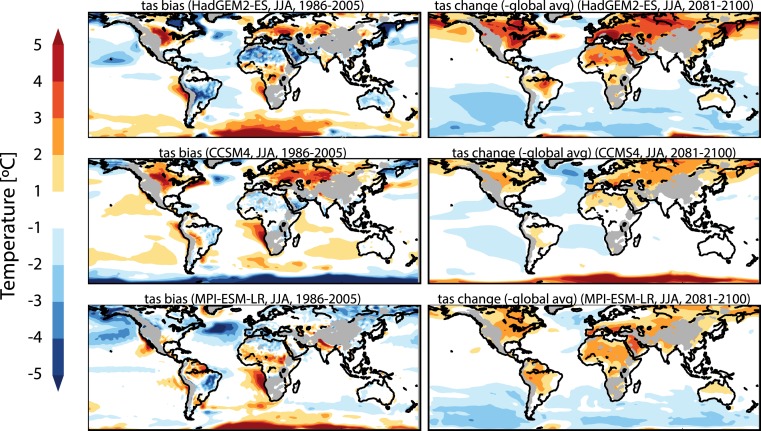
Fig. 2.
The left-hand column shows the systematic error of 3 of the leading CMIP5 models for June, July, and August (JJA) mean surface air temperature (tas) computed using ensemble integrations and observations for the period 1986 to 2005. The right-hand column shows the same 3 models' regional temperature response to climate change forcing (computed as the departure from the global mean) based on differences between ensemble integrations for the period 2081 to 2100 following the RCP8.5 scenario and the period 1986 to 2005. The same scale is used for both columns. There arewidespread regions where the magnitude of systematic error is comparable with or exceeds the magnitude of the climate change signal.

