Fig. 8.
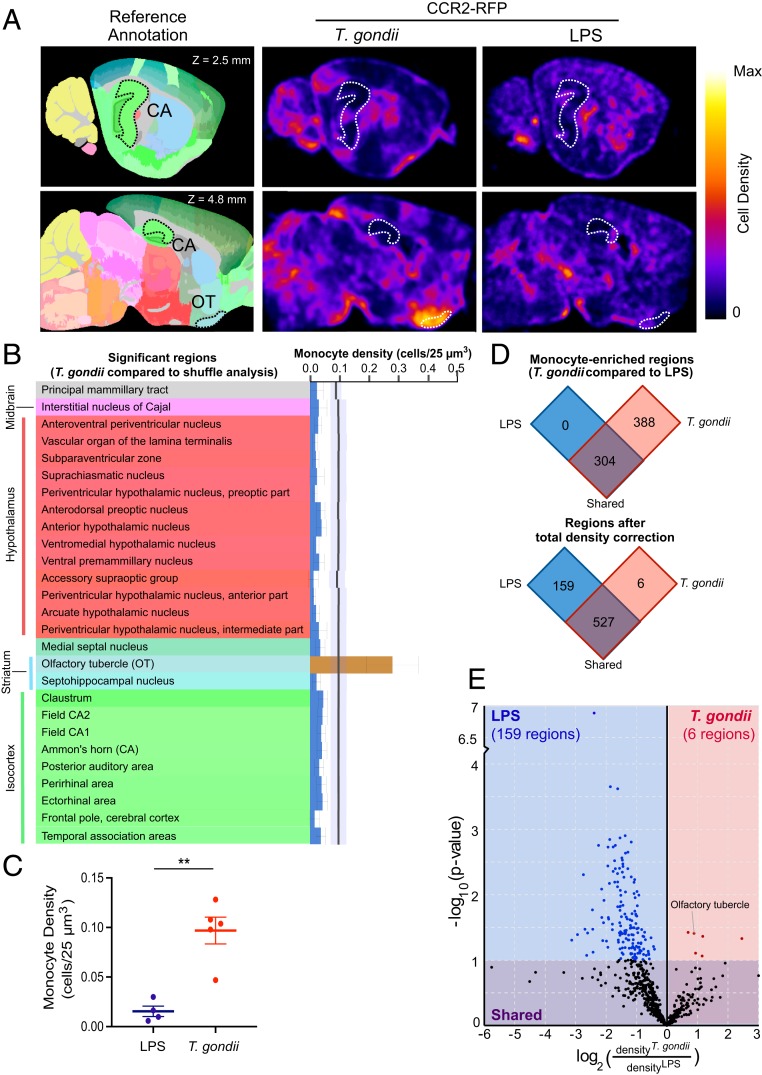
Brain-wide monocyte localization during T. gondii infection and LPS-induced inflammation. Monocyte signal from CCR2RFP/+ mouse brains was regionalized by alignment with the mouse reference atlas (Allen Brain Institute). (A) Allen reference annotation is shown with CA (Ammon’s horn) and OT (olfactory tubercle) outlined (Left). Mean density heatmaps of monocyte distribution at 2 different sagittal sections were constructed using all of the brains from the T. gondii-infected and LPS-injected mice (Right). Heatmaps are normalized to the maximum density within each brain. (B) CCR2-RFP monocyte density by brain region in the Allen annotated reference atlas. The black line indicates the shuffle mean, with the corresponding SD in pale blue. Regions with significantly decreased (blue bars) or increased (brown bar) monocyte infiltration compared to the shuffle are shown. Error bars reflect the SD. (C) The total monocyte density per 25 µm3 area was calculated for T. gondii-infected and LPS-injected mice. (D) Regionalized monocyte density was compared between T. gondii-infected and LPS-injected mice without (Upper) and with (Lower) a normalization for total monocyte density per brain. (E) Brain regions enriched for monocytes in LPS-injected or T. gondii-infected mice (after total monocyte brain density correction) and their P values are shown. Parametric statistics followed by Benjamini–Hochberg correction for false-discovery rate (0.1) was used (B, D, and E). A Welch’s t test was used for (C). **P < 0.005. nT. gondii = 5 mice and nLPS = 4 mice.

