Figure 7.
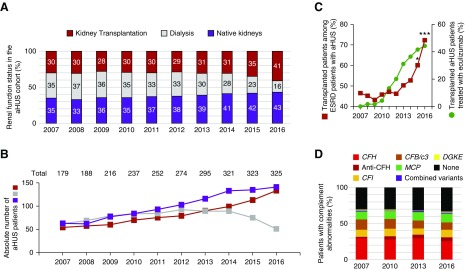
Growing frequency of recipients of kidney transplants among patients with aHUS and with ESKD paralleled the use of eculizumab. (A) Frequencies and (B) absolute numbers of patients with aHUS with functioning kidney allografts (red), who were under dialysis (light gray), or with functioning native kidneys (purple) over time. The numbers of living patients on January 1 of each year are reported. The total number of patients with aHUS for each year is indicated above the bars in (B). Notably, any transient change in the renal status (such as an immediate transplant failure) or short-term eculizumab treatment that did not continue over the following year was not captured in the census conducted on January 1 of each year. (C) Frequency of patients receiving a transplant among the patients with aHUS and ESKD (left y axis) and the frequency of recipients of kidney transplants who were treated with eculizumab on January 1 of each year (right y axis). The Fischer exact test was used to compare the frequencies between 2012 and the subsequent years; *P<0.05, ***P<0.001. (D) Abnormalities in the CAP over time in the French aHUS cohort.

