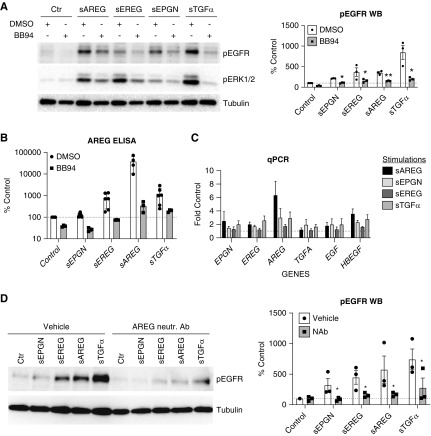
Figure 2.
Sustained EGFR reactivation requires transcription and release of endogenous AREG. (A and B) HPTCs were pretreated with DMSO or BB94 (10 ∝M) for 30 minutes and then treated with different low-affinity EGFR ligands for 24 hours. (A) EGFR phosphorylation and downstream ERK1/2 phosphorylation was quantified by Western blot (left panel) followed by densitometric analysis (graph) after normalization to control-stimulated cells (% Control). (B) Endogenous sAREG released in cell culture medium was measured by ELISA and presented as percentile of sAREG concentration in control-stimulated cell medium (% Control). (C) HPTCs were treated with different EGFR ligands (shown in the legend) for 24 hours and mRNA expression of endogenous EGFR ligands (shown in x-axis) was tested by quantitative PCR. Results are presented after normalization to non-stimulated cells (fold control). (D) HPTCs were treated with different EGFR ligands for 4 hours and then culture medium was changed to fresh medium containing AREG-neutralization antibody or vehicle for 20 hours. EGFR phosphorylation was quantified by Western blot (left panel) and by densitometric analysis (right column graph) after normalization to control-stimulated/vehicle-treated cells (% Control). Tubulin was used as loading control in (A and D). For all experiments, n=3–6. *P<0.05; **P<0.01.

