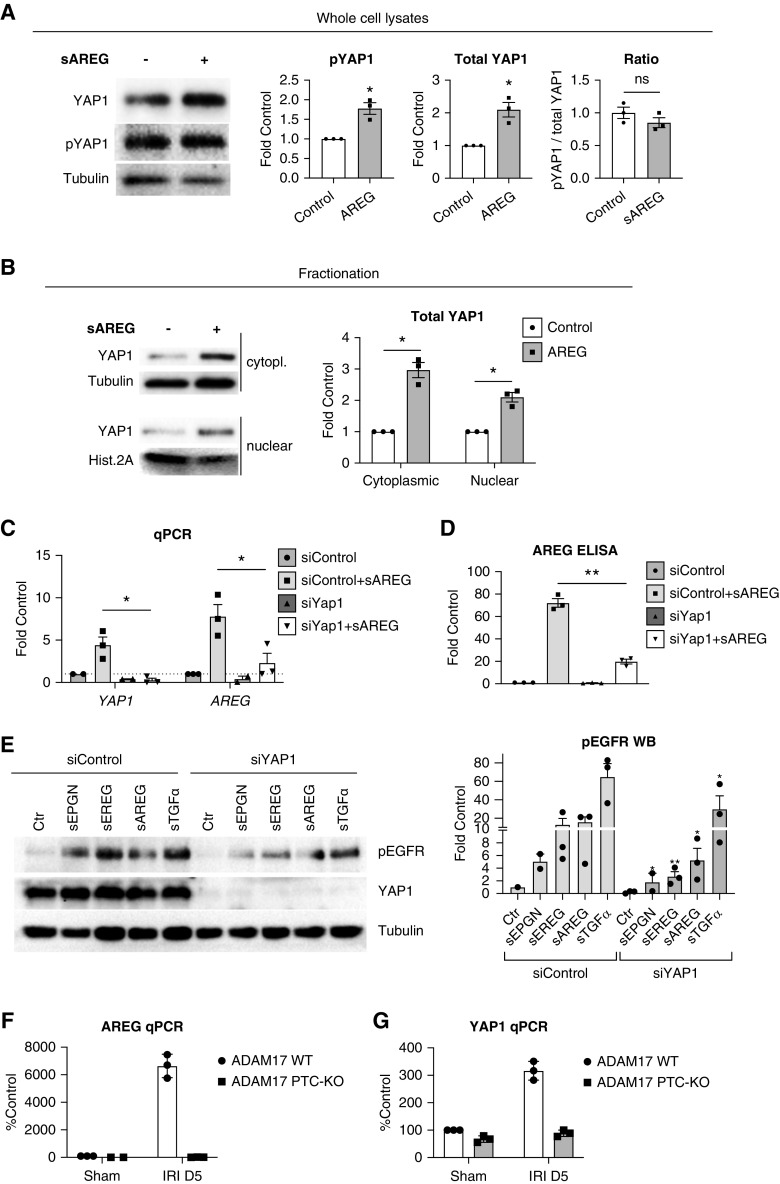
Figure 3.
AREG transcriptional upregulation and sustained EGFR reactivation require YAP1. (A) Cells were control-treated or treated with sAREG for 24 hours and total YAP1 or phospho-YAP1 (pYAP1) levels were examined by Western blot in whole cell lysates (left panel). Quantification of phospho-YAP1 and total YAP1 levels, as well as the ratio of phospho-to-total YAP1, is presented in the graphs after densitometric analysis (right panels). Tubulin was used as loading control. (B) HPTCs were control-treated or treated with sAREG for 24 hours and preparations of nuclear and cytoplasmic fractions were analyzed by Western blot (left panels). Tubulin was used as loading control for cytoplasmic fractions and histone 2A was used as loading control for nuclear fractions. Quantification of total YAP1 levels is presented after densitometric analysis (right panel graph). (C and D) HPTCs were transfected with control siRNA (siControl) or siRNA against YAP1 (siYAP1) and at 48 hours post-transfection, serum-starved cells were control-treated or treated with sAREG for 24 hours. Endogenous AREG and YAP1 expression was tested by quantitative PCR ([C], results presented as fold of siControl/control-treated cells) and release of endogenous sAREG to the cell culture medium was tested by ELISA ([D], presented as percent siControl/control-treated cells). Results are presented after normalization for siControl transfected/control-stimulated cells. (E) Control or siYAP1 transfected cells were treated at 48 hours post-transfection with different EGFR ligands for 24 hours and EGFR phosphorylation was tested by Western blot (left panel). Densitometric analysis is presented after normalization for siControl transfected/control-stimulated cells (right panel graph, stars denote significant difference from the respective ligand-treated siControl sample). (F and G) ADAM17 PTC-KO mice or their ADAM17 WT littermates were subjected to IRI or sham surgery and after 5 days their kidneys were collected and tdTomato+ PTCs were sorted by FACS for subsequent mRNA extraction and quantitative PCR analysis of (F) AREG and (G) YAP1 expression. Results are presented after normalization to PTCs from ADAM17 WT/sham surgery mice (% Control). n=3–4; *P<0.05, **P<0.01.

