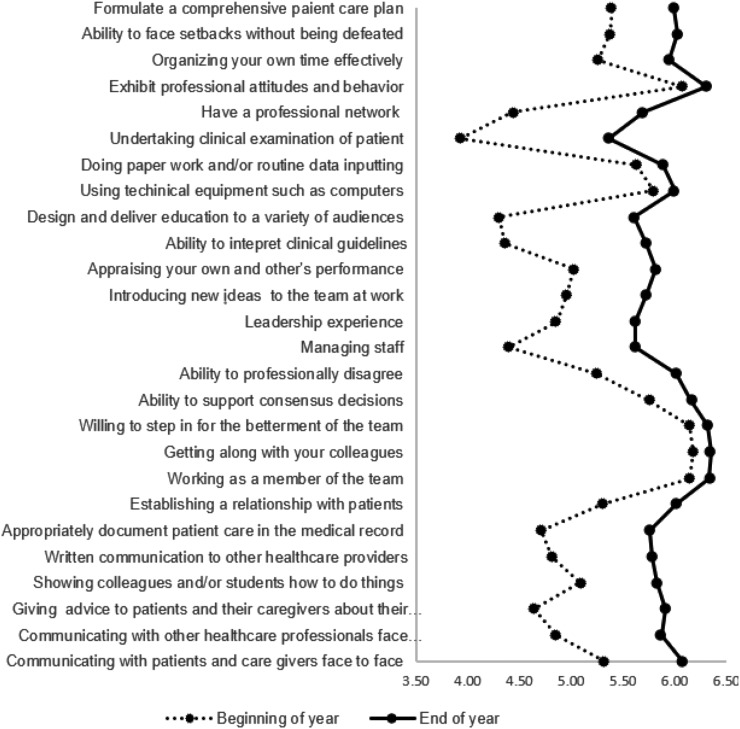
Figure 4.
P2 students’ Perceived Capabilities of Performing the Various Skills Related to a Practicing Pharmacist Between the Beginning and End of the Year
A 7-point scale was used on which 1= not well and 7=very well, to determine how well P2 students performed on each of these skills at the beginning and end of the academic year. The y-axis demonstrates the 26 skills on which the students were measured on their perceived capability of performing and the x-axis shows the mean scores of their capabilities. Each data point shows the mean score for that particular skill, the point on the dotted line for the beginning of the year and the point on the solid line for the end of that year. When the solid line is on the right side, it shows an increase in the perceived capability over the year. Additionally, when the distancebetween the dotted and solid line increases, it shows that the change was large. The data points toward the y-axis (eg, undertaking clinical examination of the patient) show that these skills had the lowest perceived capability among the students.

