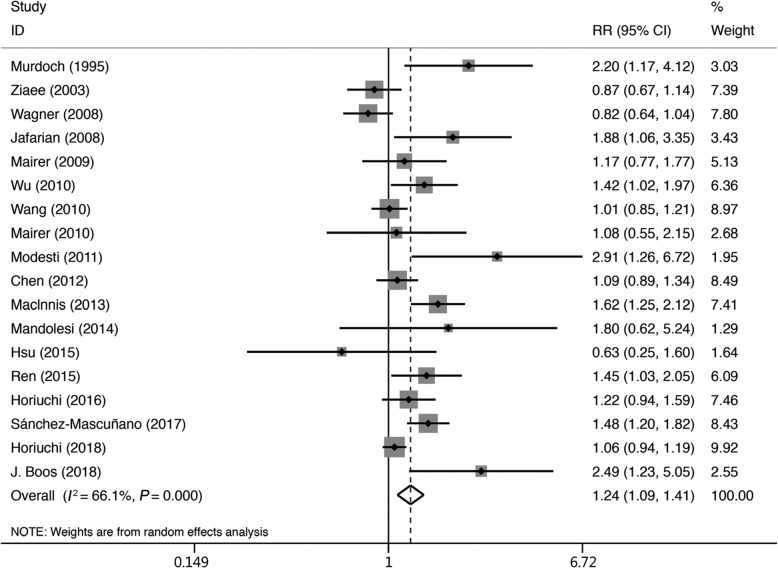
Fig. 2.
Forest plot of the 18 AMS studies in the random-effects model. Summaries of the men and women results for the risk of AMS are displayed. The risk factors are indicated based on the relative risk for women with regard to the prevalence of AMS.Heterogeneity: Tau2 = 0.0403, Chi2 = 50.15, df = 17; I2 = 66.1%, P = 0.000. Test for overall effect: Z = 3.29, P = 0.001. RR: relative risk; 95% CI: 95% confidence interval

