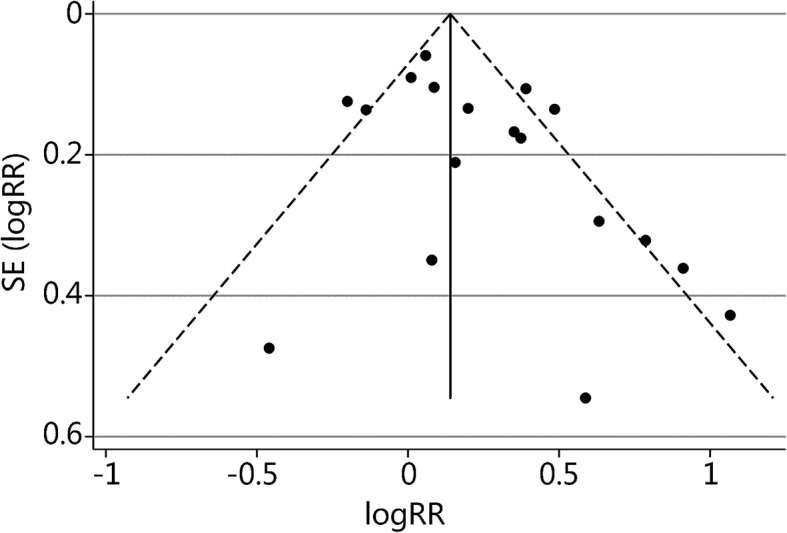
Fig. 3.

Funnel plot of the 18 AMS studies to assess publication b.ias. Note the symmetrical distribution of the studies. In addition, all studies were combined and subjected to Egger’s test (bias coefficient = 1.48, P = 0.052) and Begg’s test (P = 0.130). LogRR: log relative risk; SE (LogRR): standard error of the log relative risk
