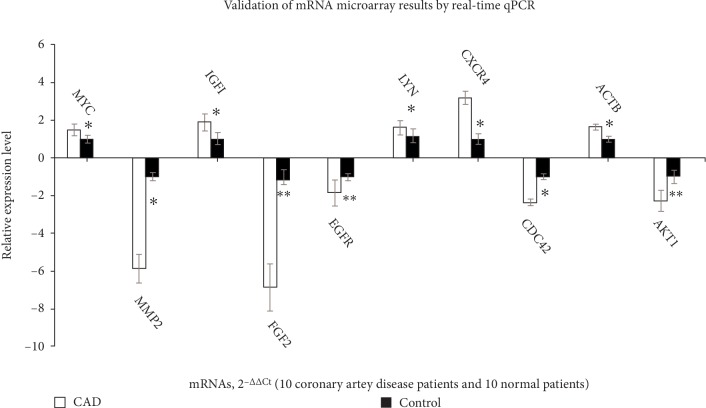
Figure 5.
Validation of the mRNA microarray results by real-time qPCR. mRNA microarray results were verified by real-time qPCR between the CAD group (n = 10) and the control group (n = 10). All samples were normalized to the expression of GAPDH, and the relative expression levels of each gene were analyzed using the 2−Δ Δ Ctmethod. ∗P < 0.05, ∗∗P < 0.01.

