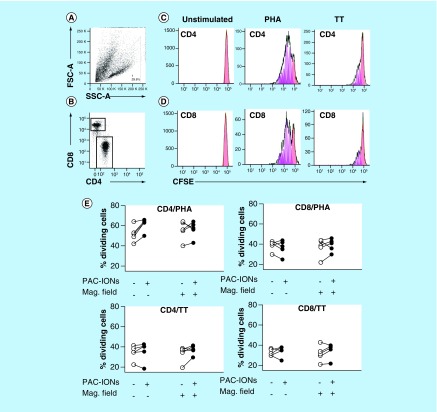
Figure 8. . The differentiation into mature macrophages differentiated in the presence of the poly(acrylic acid)-coated iron oxide nanoparticles and exposed to the magnetic field retains the ability to stimulate the proliferation of autologous CD3+ T cells.
MDMs were differentiated in the absence or presence of the PAC-IONs for 5 days and non-exposed or exposed to a 1.5-T MF for 10 min. Autologous CFSE+ CD3+ T cells were added (1:2 ratio; MDMs:T cells) and stimulated with PHA or TT for 96 h. CD3+ T cells were stained with anti-CD4 and anti-CD8 mAbs. Flow cytometry FSC-A versus SSC-A dot plots for selection of viable lymphocytes (A) followed by gating of CD4+ and CD8+ subpopulations (B) to evaluate their proliferation in response to a negative control, PHA and TT by the dilution of CFSE. Histograms from a representative experiment show resting cells (red), dividing cells (pink) and the predicted model of cell proliferation (green line) in the FlowJo software version 7.6.2 (C, CD4+ and D, CD8+ T cells). Consolidated data of the percentages of dividing CD4+ and CD8+ T cells (E). Differences were evaluated with the Wilcoxon test, n = 5, independent experiments.
ANOVA: Analysis of variance; CBA: Cytometric bead array; CFSE: Carboxyfluorescein diacetate succinimidyl ester; FSC: Forward scatter; mAb: Monoclonal antibody; MDM: Differentiation into mature macrophage; MF: Magnetic field; PAC-ION: Poly(acrylic acid)-coated iron oxide nanoparticle; PHA: Phytohemagglutinin; SSC: Side scatter; TT: Tetanus toxoid.

