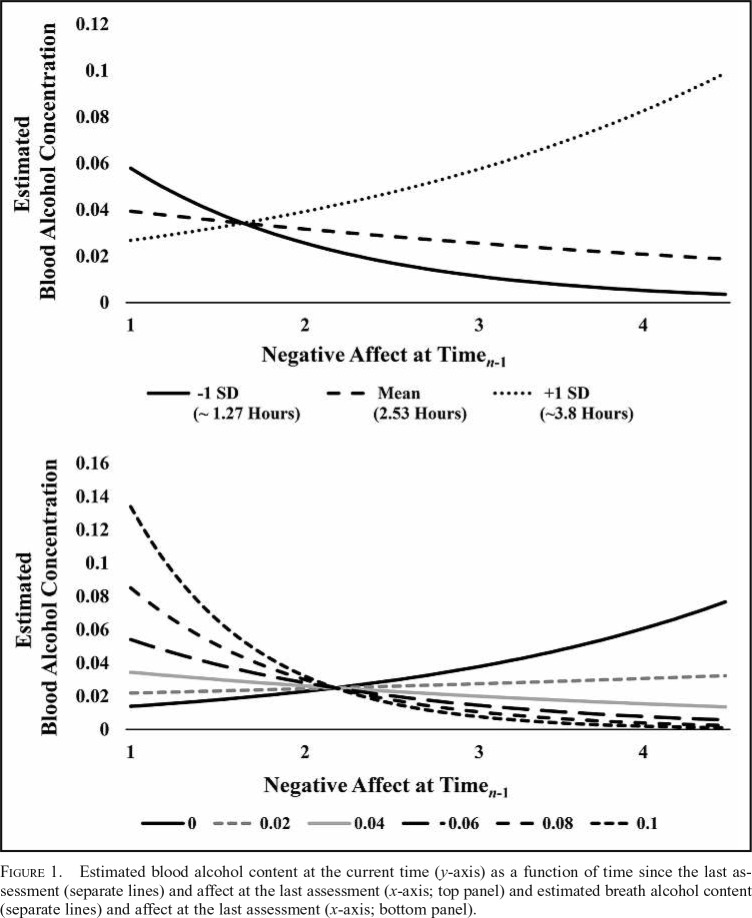
Figure 1.
Estimated blood alcohol content at the current time (y-axis) as a function of time since the last assessment (separate lines) and affect at the last assessment (x-axis; top panel) and estimated breath alcohol content (separate lines) and affect at the last assessment (x-axis; bottom panel).

