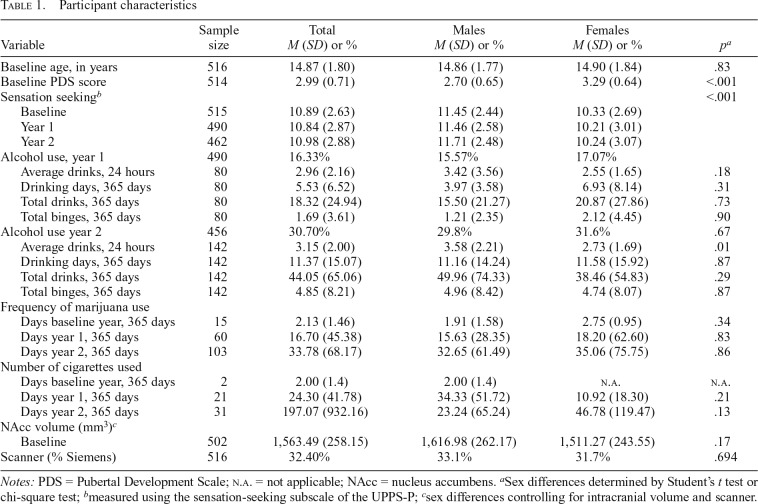
Table 1.
Participant characteristics
| Variable | Sample size | Total M (SD) or % | Males M (SD) or % | Females M (SD) or % | pa |
| Baseline age, in years | 516 | 14.87 (1.80) | 14.86 (1.77) | 14.90 (1.84) | .83 |
| Baseline PDS score | 514 | 2.99 (0.71) | 2.70 (0.65) | 3.29 (0.64) | <.001 |
| Sensation seekingb | <.001 | ||||
| Baseline | 515 | 10.89 (2.63) | 11.45 (2.44) | 10.33 (2.69) | |
| Year 1 | 490 | 10.84 (2.87) | 11.46 (2.58) | 10.21 (3.01) | |
| Year 2 | 462 | 10.98 (2.88) | 11.71 (2.48) | 10.24 (3.07) | |
| Alcohol use, year 1 | 490 | 16.33% | 15.57% | 17.07% | |
| Average drinks, 24 hours | 80 | 2.96 (2.16) | 3.42 (3.56) | 2.55 (1.65) | .18 |
| Drinking days, 365 days | 80 | 5.53 (6.52) | 3.97 (3.58) | 6.93 (8.14) | .31 |
| Total drinks, 365 days | 80 | 18.32 (24.94) | 15.50 (21.27) | 20.87 (27.86) | .73 |
| Total binges, 365 days | 80 | 1.69 (3.61) | 1.21 (2.35) | 2.12 (4.45) | .90 |
| Alcohol use year 2 | 456 | 30.70% | 29.8% | 31.6% | .67 |
| Average drinks, 24 hours | 142 | 3.15 (2.00) | 3.58 (2.21) | 2.73 (1.69) | .01 |
| Drinking days, 365 days | 142 | 11.37 (15.07) | 11.16 (14.24) | 11.58 (15.92) | .87 |
| Total drinks, 365 days | 142 | 44.05 (65.06) | 49.96 (74.33) | 38.46 (54.83) | .29 |
| Total binges, 365 days | 142 | 4.85 (8.21) | 4.96 (8.42) | 4.74 (8.07) | .87 |
| Frequency of marijuana use | |||||
| Days baseline year, 365 days | 15 | 2.13 (1.46) | 1.91 (1.58) | 2.75 (0.95) | .34 |
| Days year 1, 365 days | 60 | 16.70 (45.38) | 15.63 (28.35) | 18.20 (62.60) | .83 |
| Days year 2, 365 days | 103 | 33.78 (68.17) | 32.65 (61.49) | 35.06 (75.75) | .86 |
| Number of cigarettes used | |||||
| Days baseline year, 365 days | 2 | 2.00 (1.4) | 2.00 (1.4) | n.a. | n.a. |
| Days year 1, 365 days | 21 | 24.30 (41.78) | 34.33 (51.72) | 10.92 (18.30) | .21 |
| Days year 2, 365 days | 31 | 197.07 (932.16) | 23.24 (65.24) | 46.78 (119.47) | .13 |
| NAcc volume (mm3)c | |||||
| Baseline | 502 | 1,563.49 (258.15) | 1,616.98 (262.17) | 1,511.27 (243.55) | .17 |
| Scanner (% Siemens) | 516 | 32.40% | 33.1% | 31.7% | .694 |
Notes: PDS = Pubertal Development Scale; n.a. = not applicable; NAcc = nucleus accumbens.
Sex differences determined by Student’s t test or chi-square test;
measured using the sensation-seeking subscale of the UPPS-P;
sex differences controlling for intracranial volume and scanner.

