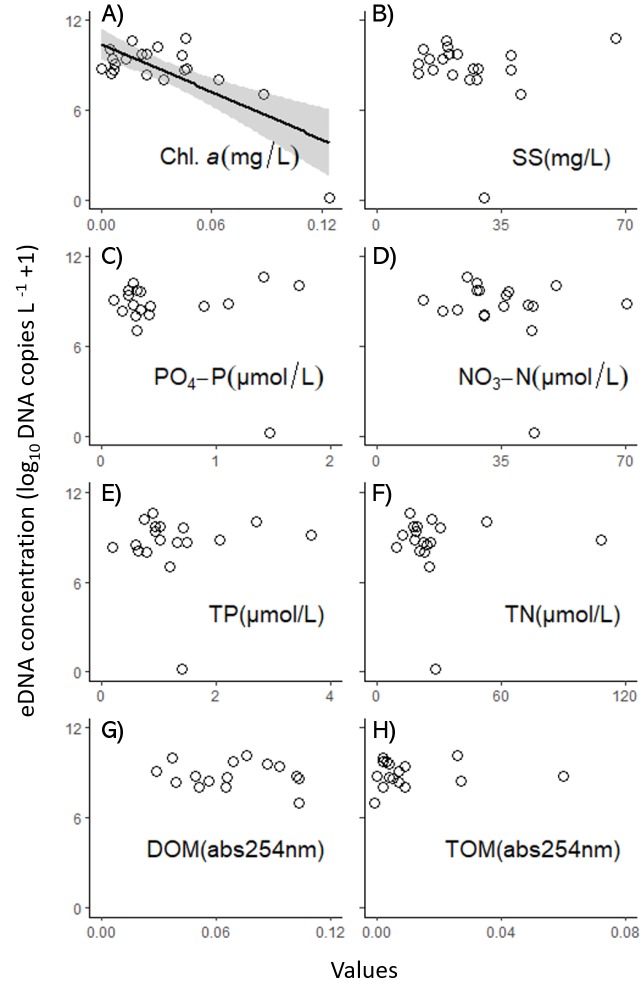
Figure 3. Relationships between each water-quality factor and the eDNA concentration of the red-eared slider in the ponds (A: Chl. a, B: SS, C: PO 4-P, D: NO3-N, E: TP, F: TN, G: DOM, H: TOM).
The regression curve of Chl. a was drawn by linear regression with 95% confidence intervals for the slope (R2 = 0.54, p < 0.001).

