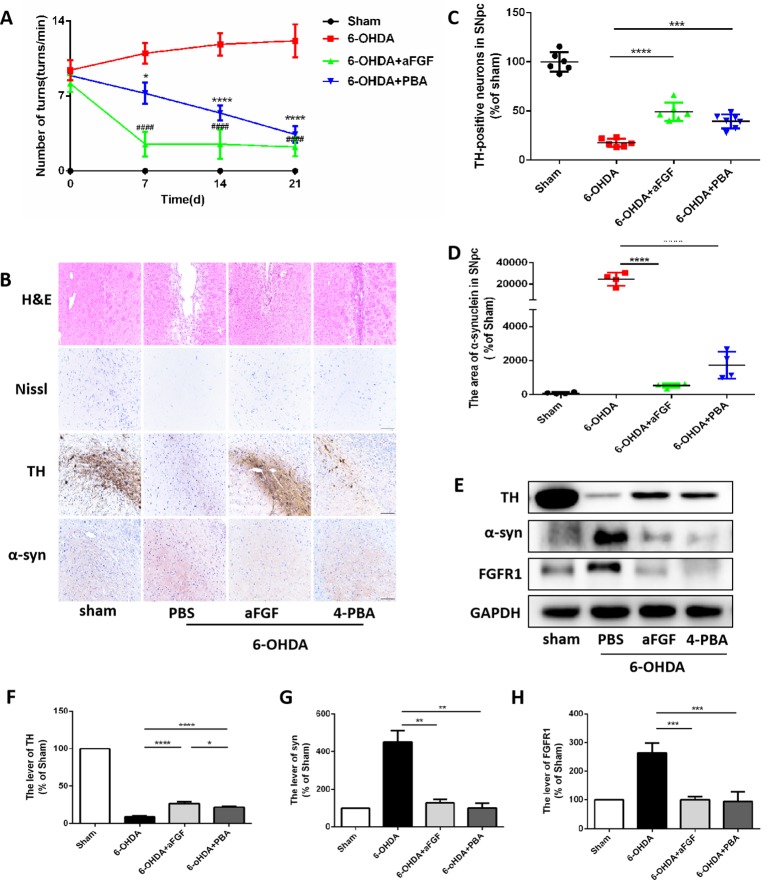
Figure 2.
aFGF treatment attenuates 6-OHDA-induced PD via inhibiting ER stress. (A) The number of rotations (turns/min) on the affected side of rats during rotational behavior test, n = 12. #### P < 0.0001: aFGF group vs. 6-OHDA group; ****P < 0.0001: 4-PBA group vs. 6-OHDA group. (B) H&E staining of striatum region, Nissl staining of nigral region, and immunohistochemistry staining results of TH and α-syn expression in striatum region. Scale bar = 50 μm, n = 6. (C, D) Quantitative analysis of immunohistochemistry staining results of TH and α-syn expression in striatum region. (E) Western blot results of TH, α-syn and FGFR1 expressions. (F–H) Quantitative analysis results of TH, α-syn, and FGFR1 expressions, *P < 0.05, **P < 0.01, ***P < 0.001, ****P < 0.0001 vs. the other group, n = 6.

