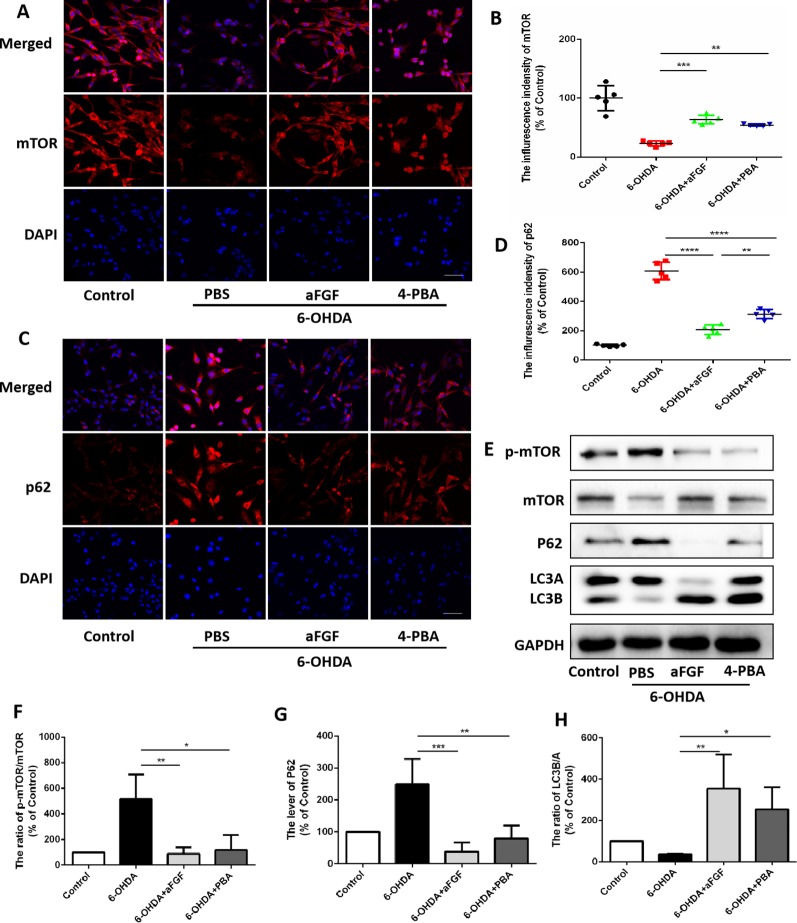
Figure 6.
aFGF administration activates autophagy by inhibiting ER stress in PC12 cells. (A–D) Representative fluorescence images and quantitative analysis of mTOR and p62 expressions in PC12 cells. Scale bar = 50 μm, n = 5. (E) Western blot results of p-mTOR, mTOR, p62 and LC3 expressions in PC12 cells. (F–H) Quantitative analysis results of p-mTOR, mTOR, p62 and LC3 expressions in PC12 cells. *P < 0.05, **P < 0.01, ***P < 0.001, ****P < 0.0001 vs. the other group, n = 3.

