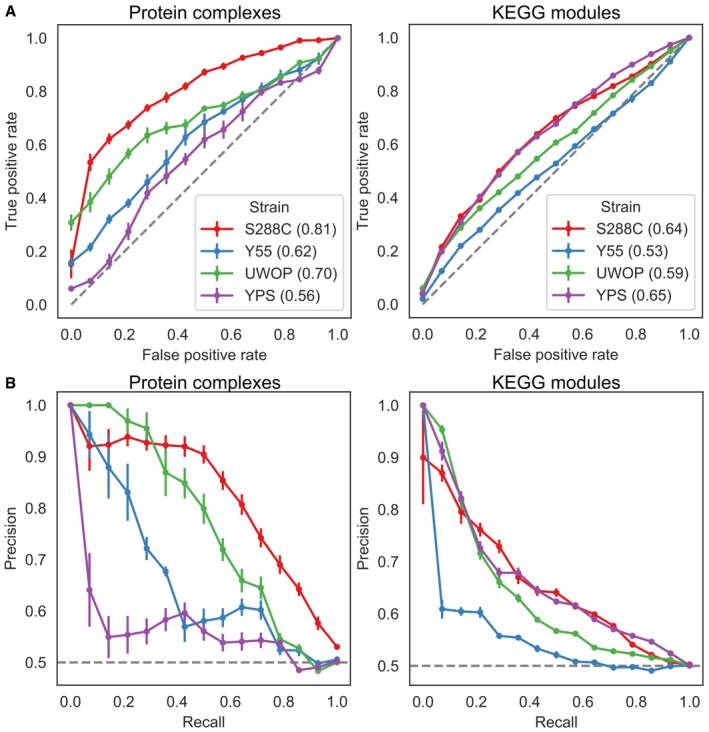
Figure EV1. Benchmarking of S‐scores.

-
A, BReceiver operating characteristic (ROC) curves (A) and precision–recall curves (B) for two gene functional interaction sets across the four KO libraries. Numbers between parentheses in (A) represent the area under the curve (AUC). Error bars indicate the Mean Absolute Deviation over 10 replicates with random gene pairs as the negative set.
