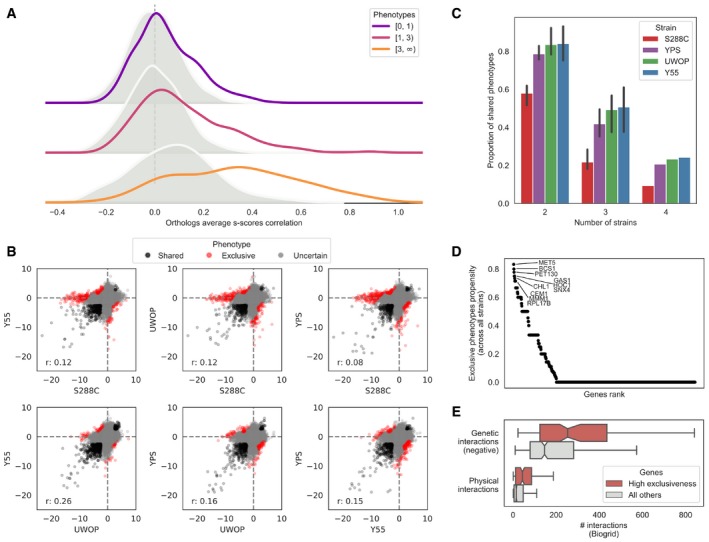
Average S‐score Pearson's correlation between the same genes (orthologs, solid line) and random gene pairs (shaded distribution) across all the 38 conditions and four strains. Genes are stratified by the number of conditions in which they show a significant phenotype across the four strains.
S‐score scatterplots for each pairwise strain comparison, highlighting conserved phenotypes (black points), significant changes (red points) and gene–condition relationships for which no call can reliably be made (grey points). “r”, Pearson's r value.
Fraction of deletion phenotypes in each strain conserved with other stains in pairwise, three‐way and four‐way comparisons. Error bars represent standard deviation for all pairwise and three‐way comparisons. Only a four‐way comparison is possible for each strain so no error bars are represented in these cases.
Gene exclusiveness: a measure of each gene's propensity to change its chemical genomic profile across strains. The top 10 genes’ names are reported.
Genes with high exclusiveness (> 0) tend to have a higher number of negative genetic and physical interactions (as reported in the BioGRID database). The central vertical line indicates the median, the box delimits the lower and upper quartile of the distribution and the whiskers extend to 1.5 times the Inter‐Quartile Range (IQR) plus the lower and upper quartile of the distribution, respectively.

