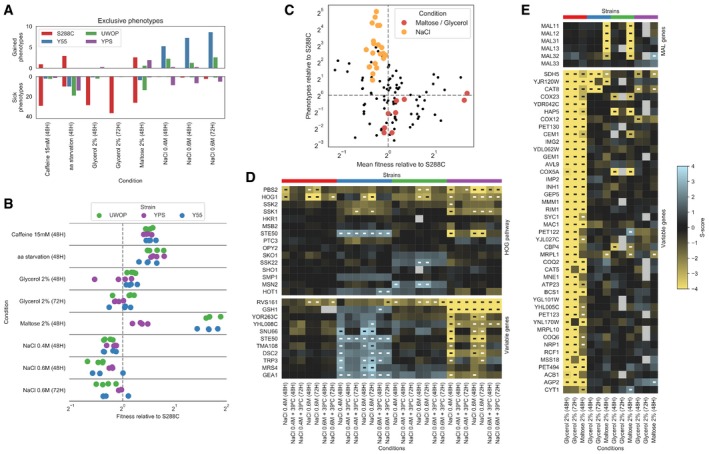
Figure 3. The fitness of the WT strain background is linked to the number of differences in KO phenotypes for a given condition.

- Barplots reporting the average number of gain and sick phenotypes that are specific to each strain across all pairwise comparisons.
- Wild‐type fitness of each strain relative to S288C across the same conditions as in panel A; each dot represents a specific replicate where colony sizes were measured.
- Relationship between the wild‐type fitness relative to S288C and the number of conditionally essential genes relative to S288C; each dot represents a strain–condition replicate as in panel B. The conditions maltose, glycerol and NaCl are highlighted.
- Changes in gene deletion phenotypes for growth on osmotic stress conditions. The top heatmap contains genes belonging to the HOG pathway, while the bottom one contains those genes whose growth phenotypes vary the most between Y55 and YPS. Significant growth phenotypes are marked with “‐”.
- Changes in deletion phenotypes for growth on glycerol and maltose. The top heatmap contains the MAL genes, while the bottom one contains those genes whose growth phenotypes vary the most between S288C and the other three strains. Significant growth phenotypes are marked with “‐”.
