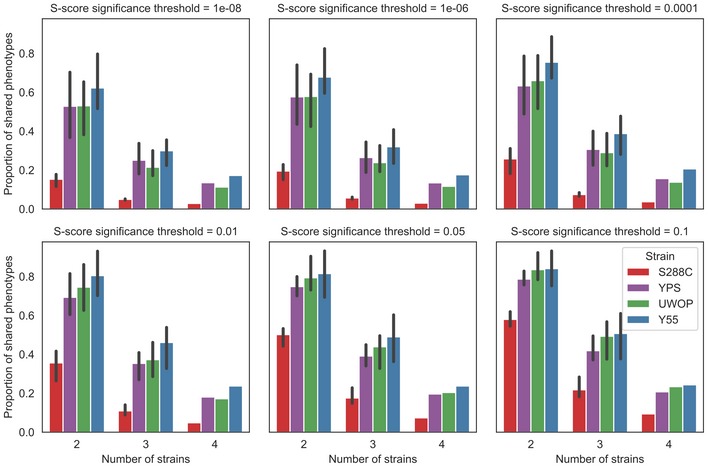
Figure EV3. General invariance of shared phenotypes when varying the significance threshold.

Proportion of shared phenotypes for different S‐score significance thresholds on calling phenotypes. Error bars indicate the 95% confidence interval.

Proportion of shared phenotypes for different S‐score significance thresholds on calling phenotypes. Error bars indicate the 95% confidence interval.