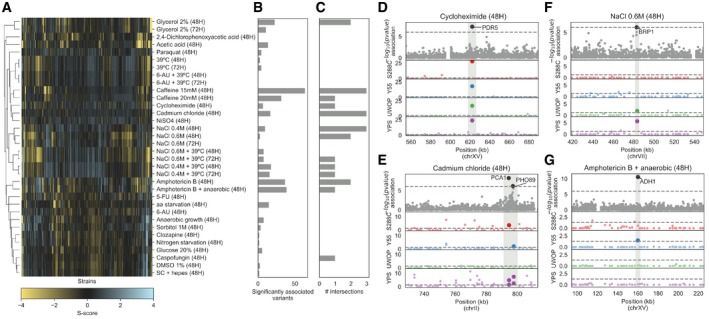
Figure 4. Genes linked to growth phenotypes via GWAS analysis in 925 natural yeast isolates.

-
AS‐score heatmap of the yeast natural isolates across 34 conditions that were also used in the KO screening.
-
BNumber of variants significantly associated (P < 1E‐6) with phenotypic variation in each growth condition.
-
CNumber of associated variants that overlap (i.e. are in a 3‐kbp window) with a conditionally essential gene in the same condition, in any of the four KO libraries.
-
D–GManhattan plots showing examples of overlaps between associated variants and the KO screening. The top plot shows the associations between variants and growth in the natural isolates as a function of the −log10 of the association P‐value, while the four bottom plots show the strength of the KO phenotypes across the four yeast strains, as a function of the −log10 of the corrected S‐score P‐value. Sections shaded in grey indicate the overlap between associations and KO data. Position in the yeast chromosome is reported in kilobase units.
