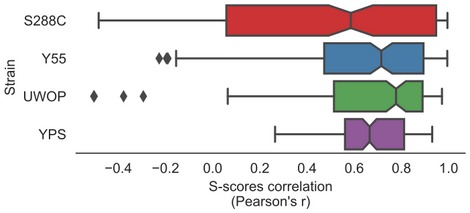
Figure EV4. Correlation between S‐scores of the original KOs and the new ones.

Each data point corresponds to an individual gene. The central vertical line indicates the median, the box delimits the lower and upper quartile of the distribution and the whiskers extend to 1.5 times the inter‐Quartile Range (IQR) plus the lower and upper quartile of the distribution, respectively.
