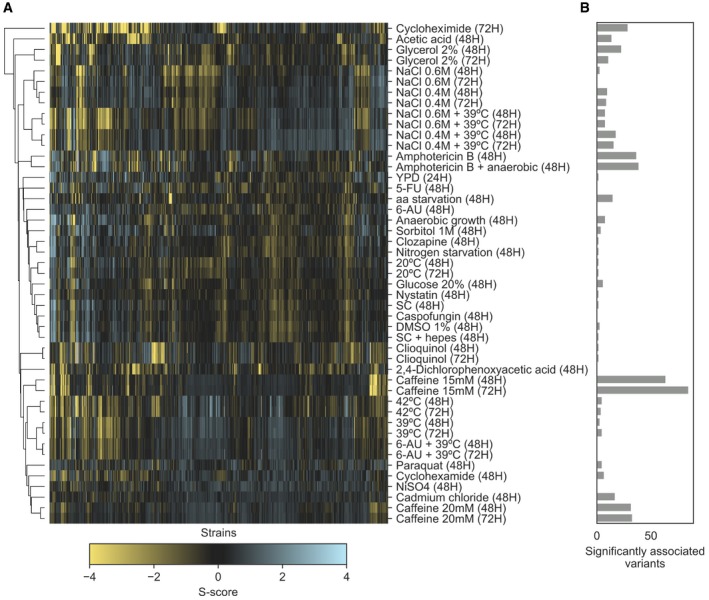
Figure EV6. Growth profiles of the 925 yeast natural isolates.

- Clustermap of S‐scores for the whole set of conditions in which the natural isolates were tested in.
- Number of significantly (P < 1E‐6) associated variants across the same conditions as in panel (A).
