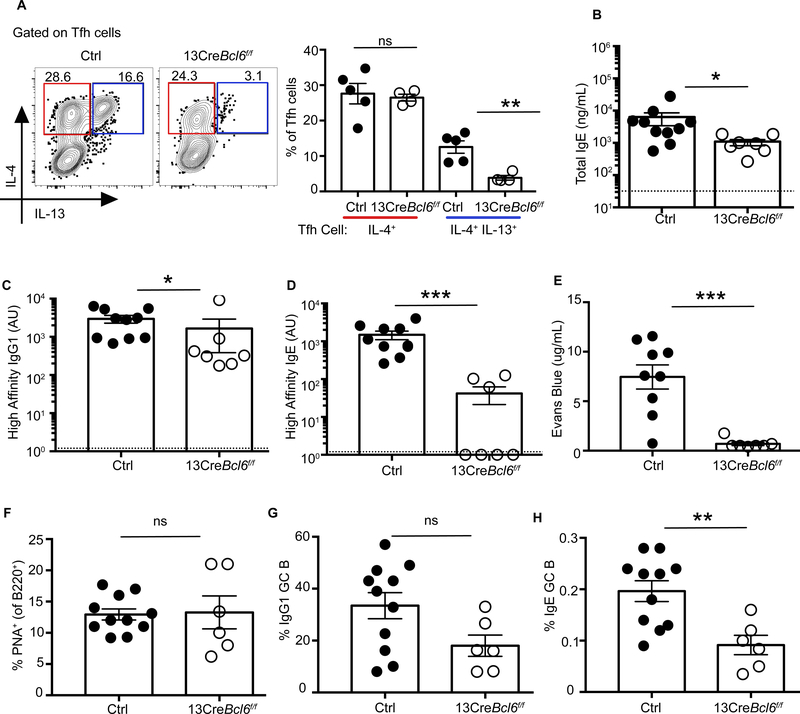
Fig. 6. Loss of Tfh13 cells abrogates the production of high-affinity IgE.
13CreBcl6fl/fl or control Bcl6fl/fl mice were immunized and boosted with Alternaria extract and NP19-OVA. (A) Intracellular expression of IL-4 and IL-13 from day 8 MedLN Tfh cells induced after primary immunization is depicted as representative flow cytometry plots (left) and summary bar graphs (right). (B to E) Day 8 post-boost sera were analyzed for (B) total IgE, (C) NP7-specific high-affinity IgG1 (D), NP7-specific high-affinity IgE, and (E) anaphylactic ability by PCA after i.v. challenge with NP7-BSA. (F to H) Day 7 post-boost MedLN cells were analyzed for: (F) B220+PNA+ GC B cells, (G) percentage of GC B cells expressing IgG1, and (H) percentage of GC B cells expressing IgE. Each symbol indicates an individual mouse. Numbers in flow plots indicate percentages. Error bars indicate SEM. Statistical tests: Student’s t test (A and F to H); Mann–-Whitney U test (B to E). *P<0.05, **P<0.01. Dotted lines in bar graphs represent background readings of sera from naïve mice. Data are either representative of two independent experiments (A) or from two pooled experiments (B to H) with three to six mice per group.

