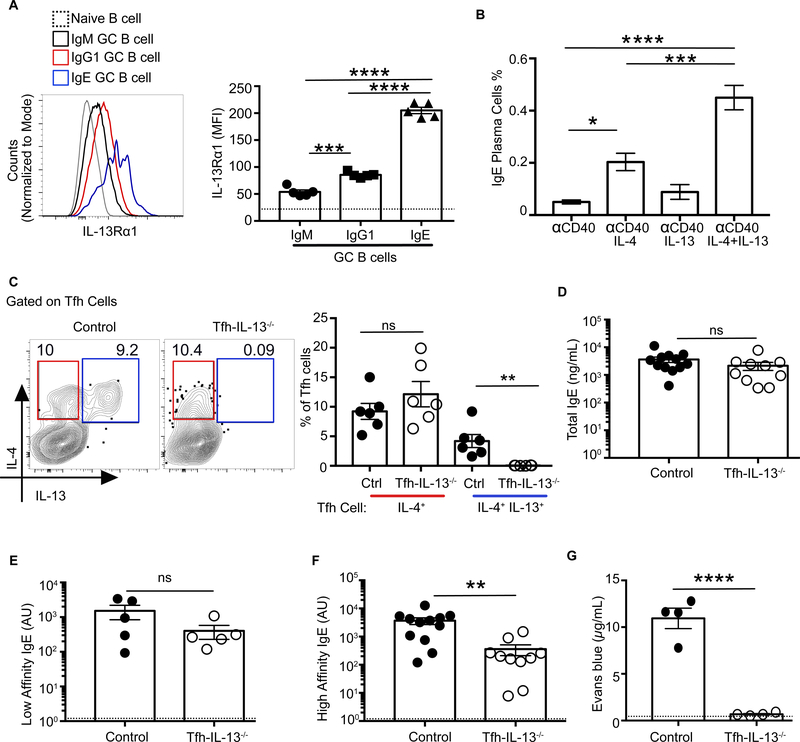
Fig. 7. Tfh cell-derived IL-13 is required for anaphylactic IgE production.
(A) Expression of IL-13Rα1 on MedLN GC B cells at day 9 after immunization with Alternaria and NP-OVA is shown as histogram overlay (left) and summary bar graphs (right). Gating strategy as in fig. S15B. (B) Day 8 MedLN lymphocytes from Alternaria and NP-OVA immunized WT mice were cultured with α-CD40 and IL-4 and/or IL-13 for 3 days, and IgE plasma cells were quantified by staining the cells for intracellular IgE and CD138. (C to G) Mixed bone marrow chimeric mice were generated from Il-13−/− and Cd4Cre Bcl6fl/fl donor bone marrow (Tfh-IL-13−/− chimeric mice) or WT and Cd4Cre Bcl6fl/fl donor bone marrow (control chimeric mice). Chimeric mice were immunized and boosted with Alternaria and NP20-OVA. (C) IL-4 and IL-13 expression by day 8 Tfh cells post-boost from Tfh-IL-13−/− or control chimeras is shown as flow cytometry plots (left) or as summary bar graphs (right). (D to F) Day 8 after-boost sera from Tfh-Il-13−/− or control chimeras were analyzed by ELISA for (D) total IgE, (E) low-affinity IgE using NP-40 BSA, and (F) high-affinity IgE using NP7-BSA. (G) Evans blue dye quantification after PCA assay with day 9 after-boost sera from Tfh-Il-13−/− or control chimeras after i.v. challenge with NP7BSA. Each symbol indicates an individual mouse. Error bars indicate SEM. Dotted lines in bar graphs represent (A) IL-13Rα1 expression on naïve B cells or (E and F) background readings of sera from naïve mice. Statistical tests: ANOVA (A and B); Student’s t test (C and G); Mann-Whitney U test (D to F). *P<0.05, **P<0.01, ***P<0.001, ****P<0.0001. Data are either from two pooled experiments (D and F) or are representative of at least two independent experiments with three to seven mice per group.

