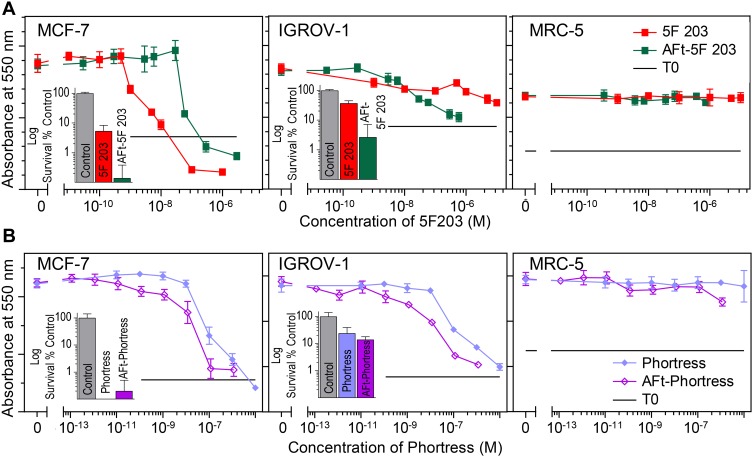
Figure 2.
MTT assay (72 hrs exposure) dose–response curves of (A) 5F 203 and AFt-5F 203 and (B) Phortress and AFt-Phortress in MCF-7, IGROV-1 and MRC-5 cell lines. Data points are mean ± SD, n = 4 in one representative trial, number of independent trials = 3. Insets: Clonogenic assay displaying survival fractions following 24 exposure treated at GI50 values in corresponding cell lines. Data points are mean ± SD, taken from 3 independent trials where n=4 per trial.

