
Fig. 3.
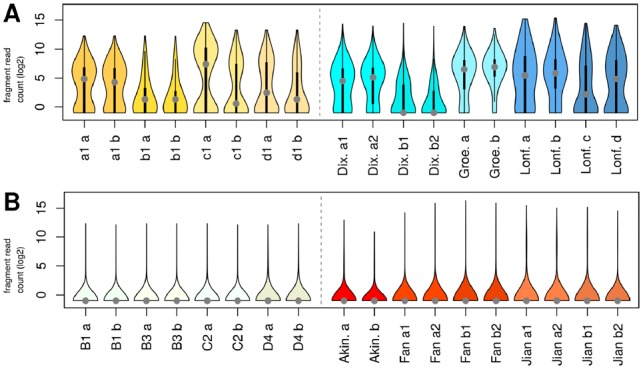
Violin plots for log2-transformed fragment read counts. (A) Near-cis simulation data for sample 1 of the condition and control group from datasets a1, b1, c1 and d1 (left), and published data samples with comparable number of near-cis fragments (right). The central part of each ‘violin’ corresponds to a standard boxplot, with a grey dot as marker for the median; symmetric curves at the sides depict the probability density. (B) Far-cis simulation data B1, B3, C2 and D4 (left), and published datasets with comparable number of cis fragments (right)