
Fig. 4.
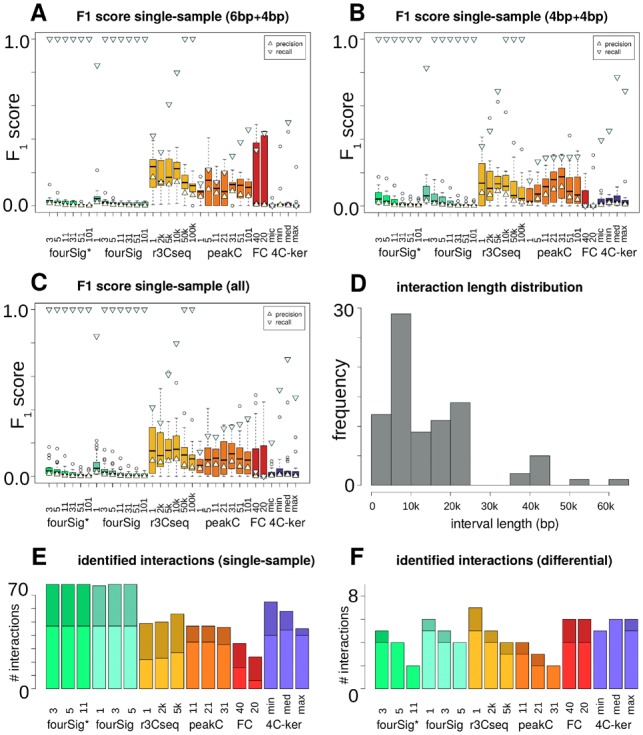
Benchmarking results for published data in near-cis. (A) Boxplots of single-sample-based F1 scores for 4C-seq algorithm variants, including markers for precision and recall, restricted to 6 + 4 bp data only. (B) Similar to (A), but restricted to 4 + 4bp data only. (C) Similar to (A), with all interactions and samples included. (D) Approximated lengths of the actual 4C-seq interaction intervals. (E) Number of identified single-sample interactions per algorithm (78 total). Upper/dark: 6 + 4bp, lower/bright: 4 + 4bp. (F) Similar to (E), but with number of identified differential interactions per algorithm (9 total)