Fig. 4.

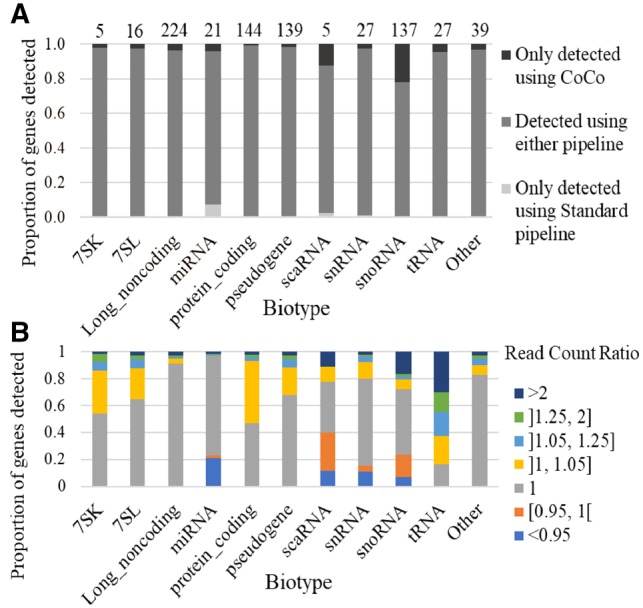
Effect of the CoCo pipeline on gene quantification of fragmented TGIRT-seq datasets by biotype. (A) The proportion of transcripts detected by either only the standard pipeline (light grey), both the standard and CoCo (intermediate grey) or only by the CoCo (dark grey) pipelines is shown as a bar graph. The number of genes only detected using CoCo is indicated at the top of the graph for each biotype considered. (B) Impact of CoCo on the read counts of different biotypes. Shown is a bar graph indicating the proportion of genes of each biotype displaying the indicated change in abundance following the CoCo correction . (Color version of this figure is available at Bioinformatics online.)
