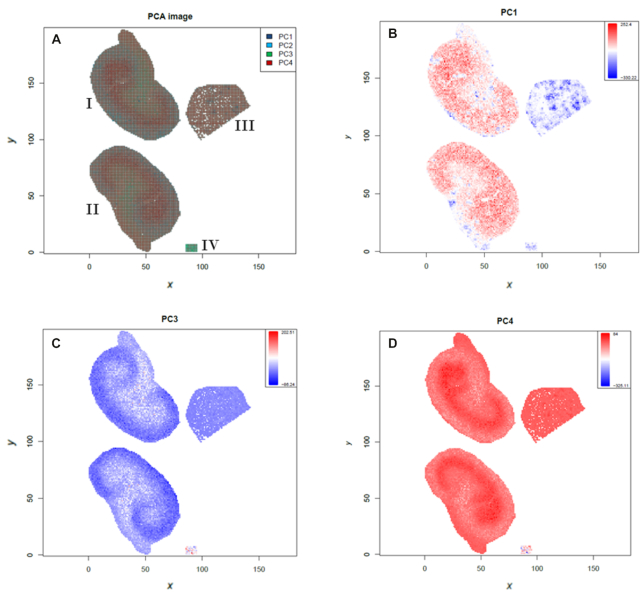
Figure 5:
Results from the unsupervised statistical analysis of N-linked glycans in murine kidney tissues. Principal component analysis (PCA) of treated, control, and calibrant files. A, Overlay of all principal component (PC) scores. B–D, Principal components 1, 3, and 4 that discriminate treated and control tissue or different kidney compartments. I = treated kidney1, II = treated kidney2, III = control kidney, IV = calibrants.

