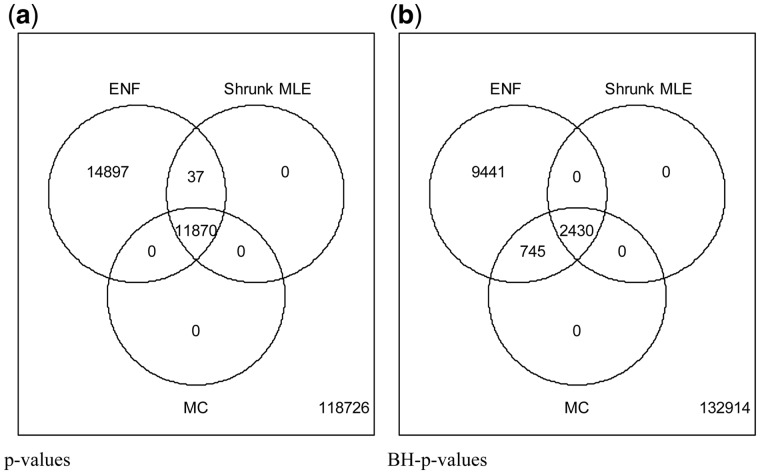
Fig. 7.
Amount of significant edges related to lung samples’ expression in M.musculus. Analysis of M.musculus RNA-seq expression data from lung samples (Steed et al., 2017). The estimator produces an optimal shrinkage 0.11. Three methods are compared at ; ENF, Shrunk MLE and MC (with 40 iterations). Panel (a) Venn diagram of significant partial correlations (i.e. edges in the GGM) recovered by each method with un-adjusted P-values. Panel (b) Venn diagram of significant partial correlations recovered by each method with BH-adjusted P-values

