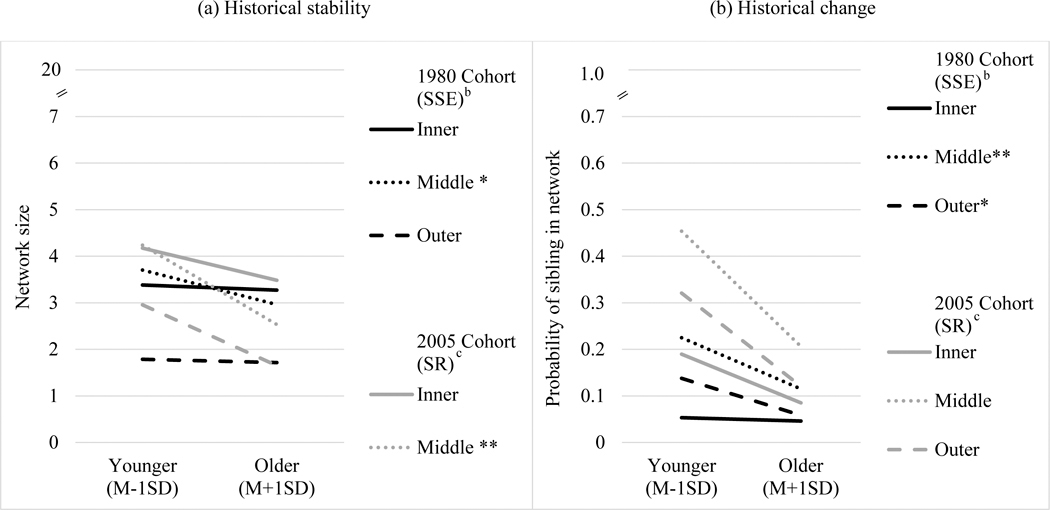
Figure 3.

Historical stability and change: Effect of respondent age on network structure and composition by closeness a
**p < .01, *p < .05
a Stars denote significant differences in the age by closeness interaction within a cohort. Inner circle by age is the reference group.
b SSE: Social Supports of the Elderly
c SR: Social Relations Study
