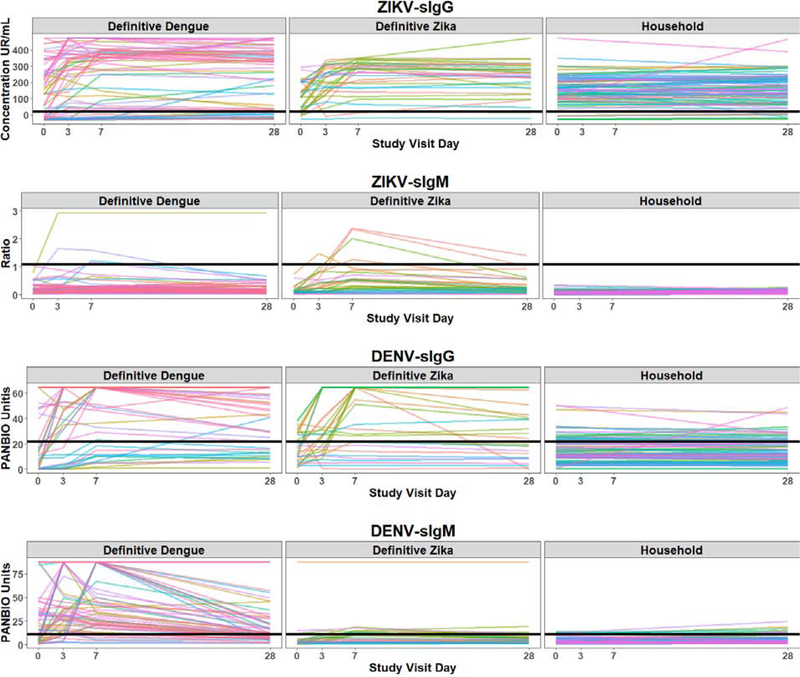
Figure 2.
Spaghetti plots for ZIKV and DENV sIgG and sIgM among the three cohorts: ZIKV-sIgG (row 1), ZIKV-sIgM (row 2), DENV-sIgG (row 3) and DENV-sIgM (row 4) by study visit for each cohort: Definitive Dengue, Definitive Zika and Household. Each colored line represents the trajectory of one subject in the study. The horizontal black line represents the manufacturer-recommended cutoff for defining seropositivity.

