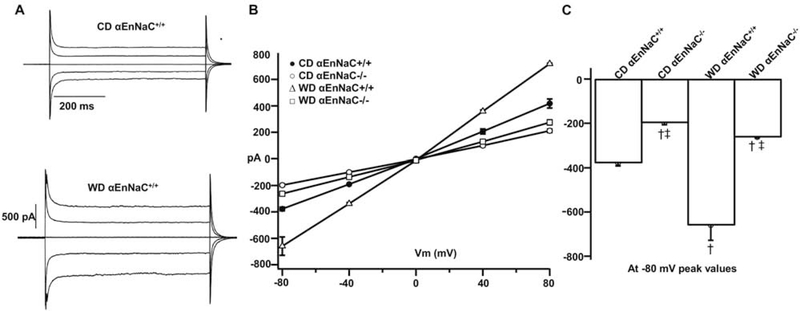
Fig 1.
αEnNaC−/− mice prevents WD-induced increases of inward Na+ currents on isolated lung ECs. Na+ current tracings (A), group I-V curves of Na+ currents (B), and comparison of peak inward Na+ currents at −80 mV (C) in αEnNaC+/+ and αEnNaC−/− mice fed a WD, n=31–38 cells.† p<0.01 compared with CD αEnNaC+/+ group; ‡ p<0.01 compared with CD or WD αEnNaC+/+ group in multiple comparison analysis.

