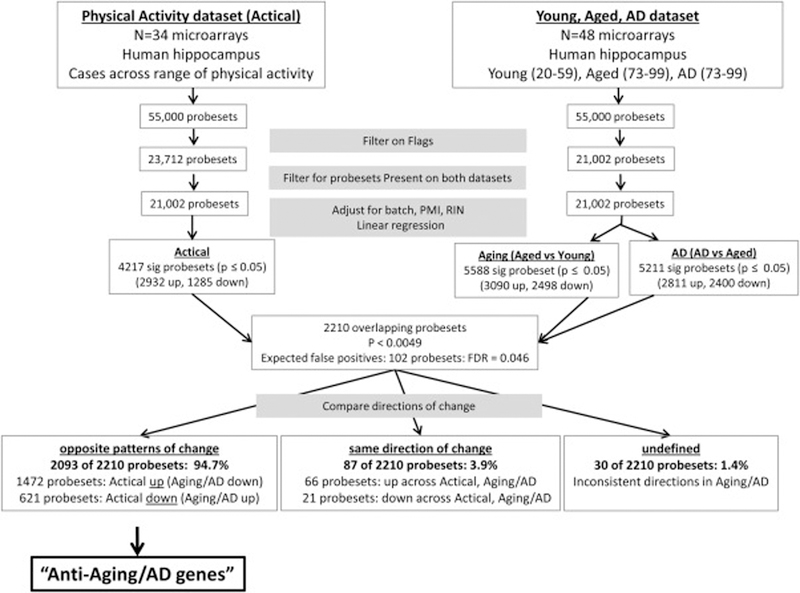
Figure 1.
Flowchart of the Methods to determine if physical activity-related gene expression patterns counter aging and AD-related expression change. 34 microarrays profiling gene expression in the aged human hippocampus were used to determine the relationship between gene expression and physical activity. Poorly performing probesets were eliminated by filtering the array data based on flags (Present, Marginal, Absent) using MAS preprocessing, retaining only probesets flagged Present on all samples of at least one group (low, moderate, high activity) (23,034 probesets). Using the programming environment R (http://www.R-project.org/), multiple linear regression was applied to GC-RMA normalized values using lm( ) to adjust for technical factors that were potential confounding variables (batch, RIN, and PMI) and to evaluate the relationship between gene expression and late-life physical activity levels across the 34 samples. In parallel, Aging and AD-related gene expression change was assessed using 51 CEL files from the public gene expression omnibus (http://www.ncbi.nlm.nih.gov/geo, dataset accession number GSE:11882) profiling expression patterns of 54,675 probesets in hippocampal samples from young cases (20–59 yrs, n=17), cognitively intact aged cases (73–99 yrs, n=20), and AD cases (73–99 yrs, n=14). The ~55,000 probesets on the array were filtered using MAS preprocessing derived flags to retain only probesets flagged Present on all samples of at least one treatment group (21,002 probesets). Using R, multiple linear regression was applied to GC-RMA normalized values to adjust for batch, RIN, and PMI and to evaluate gene expression changes in Aging (aging vs young) and AD (AD vs aged). Probesets significantly associated with both physical activity (p<0.05 and Aging or AD (p<0.05) were selected, patterns of expression change were compared for each probeset, and probesets showing opposite patterns of change with physical activity versus aging or AD were identified. The number of probesets expected to occur by chance in the overlap of the 2 studies is 52 probesets, calculated by multiplying the product of the p-values (0.0025) by the number of probesets that were tested in both datasets (21,002). The analysis identified 2138 probesets significantly associated with both physical activity and Aging or AD, 94.9% (2029 probesets) of which showed the opposite pattern of change with physical activity compared to Aging/AD (“Anti-Aging/AD probesets”). These probesets were analyzed for functional enrichment using DAVID.

