Figure 3.
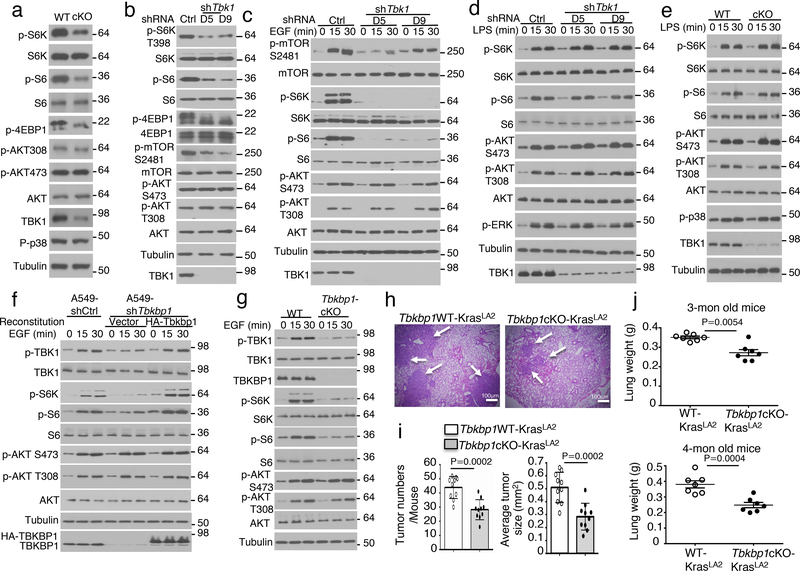
TBKBP1 and TBK1 form a growth factor signaling axis mediating mTORC1 activation and lung tumorigenesis. a-d, Immunoblot analysis of the indicated phosphorylated (P-) and total proteins in the lysates of freshly isolated lung cells from WT or Tbk1 cKO mice (a) and control or two different Tbk1-knockdown A549 cells cultured in FBS-containing medium (b) or starved in serum-free medium and restimulated with EGF (c) or LPS (d). e, Immunoblot analysis of the indicated phosphorylated (P-) and total proteins in the lysates of lung cells from WT or Tbk1 cKO mice stimulated with LPS. f, Immunoblot analysis of the indicated phosphorylated (P-) or total proteins in whole-cell lysates of control or Tbkbp1-knockdown A549 cells reconstituted with an empty vector or murine Tbkbp1 expression vector, stimulated as indicated. g, Immunoblot analysis of the indicated phosphorylated (P-) and total proteins in the lysates of lung cells from WT and Tbkbp1 cKO mice stimulated with EGF. h-j, H&E staining of lung tissue (h, scale bar, 100 μm), tumor numbers and average size (i), and lung weight (j) from 4-mon old (h,i) or the indicated ages (j) of Tbkbp1WT-KrasLA2 and Tbkbp1cKO-KrasLA2 mice (h,I, n=10 per genotype; j, n=7 per genotype). Data are representative of three independent experiments, and bar graphs are presented as mean±s.d. Two-sided unpaired Student’s t-test (i,j). Source data for graphs are provided in Statistical Source Data Fig. 3 and unprocessed blots are shown in Unprocessed Blots Fig. 3.

