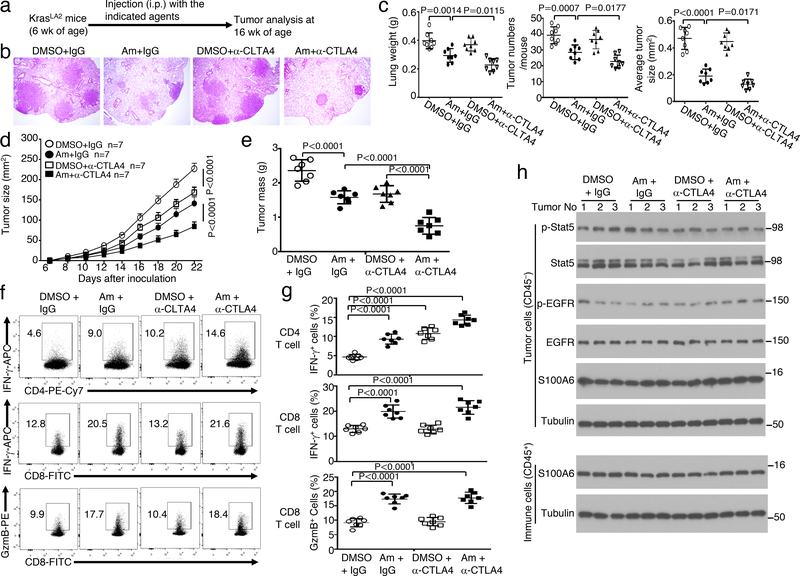
Figure 6.
A small molecule inhibitor of TBK1 inhibits lung tumorigenesis and promotes antitumor T cell responses. a-c, Schematic of experimental design (a), a representative image of H&E staining of lung tissue (b, scale bar, 100 μm), and summary graphs of lung weights, tumor numbers, and average tumor size (c) of KrasLA2 mice treated with the TBK1 inhibitor amlaxanox (Am, 25 mg/kg body weight), anti-CTLA4, amlexanox + anti-CTLA4, or vehicle (DMSO) and IgG isotype controls (n=8 per genotype). d-g, Tumor growth curves (d), summary of day 22 tumor mass (e), and flow cytometric analysis of IFNγ- and granzyme B (GzmB)-producing tumor-infiltrating CD4 and CD8 T cells presented as representative plots (f) and summary graphs (g) of LLC-injected wildtype B6 mice treated with anti-CTLA4 or an IgG isotype control (i.p., on day 3, 6, and 9), amlexanox or DMSO solvent control (at tumor site or intratumorally, from day 1 to 22). n = 7 mice per group. h, Immunoblot analysis of the indicated phosphorylated (p-) or total proteins in whole-cell lysates of tumor cells (CD45–) or tumor-infiltrating immune cells (CD45+) isolated from day 22 tumor of the LLC-implanted mice treated with as indicated. Data are representative of three independent experiments, and bar graphs are presented as mean±s.d. Two-sided unpaired Student’s t-test (c), One-way ANOVA with Bonferroni correction (e,g), Two-way ANOVA with Bonferroni correction (d). Source data for graphs are provided in Statistical Source Data Fig. 6 and unprocessed blots are shown in Unprocessed Blots Fig. 6.

