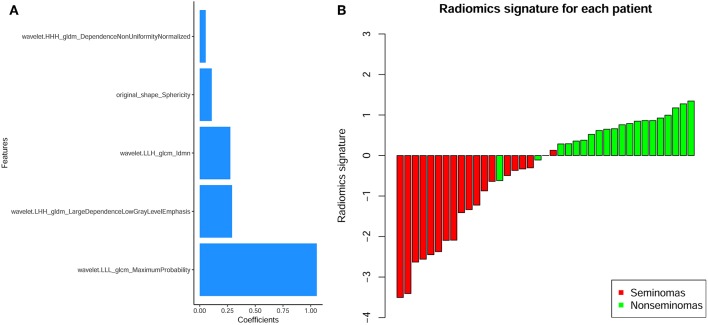
Figure 5.
(A) The contribution of the features to the radiomics signature. The histogram shows the contribution of the five features with non-zero coefficients to the radiomics signature. The features that contributed to the radiomics signature are plotted on the y-axis, and their coefficients in the LASSO Cox analysis are plotted on the x-axis. (B) Bar charts of the radiomics signature for each patient. The red bars indicate the radiomics signature of seminomas, while the light green bars indicate the radiomics signature of non-seminomas.

