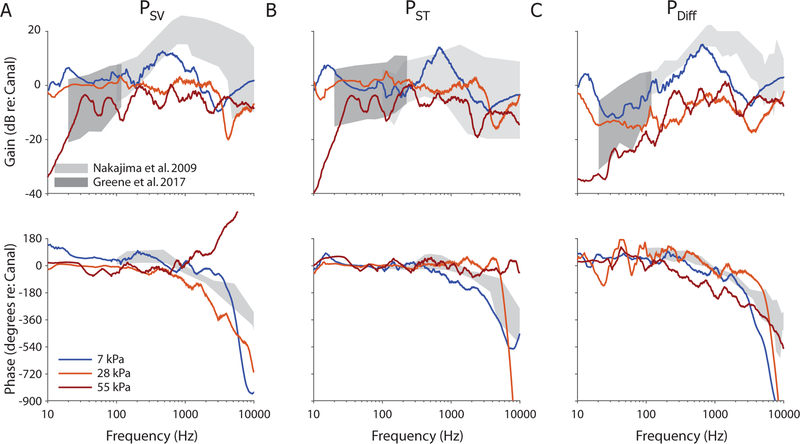
Fig. 10:
Example intracochlear pressure transfer function magnitudes and phases for the specimens and exposures shown in figures 6–8 (i.e. responses in ears 359L, 411R, and 359L, during 7, 28, and 55 kPa nominal peak pressure exposures respectively). Responses are shown superimposed onto the range of responses observed to moderate sound pressure level tone pips (gray shading) reported previously (dark: Greene et al., 2017; light: Nakajima et al., 2009).

