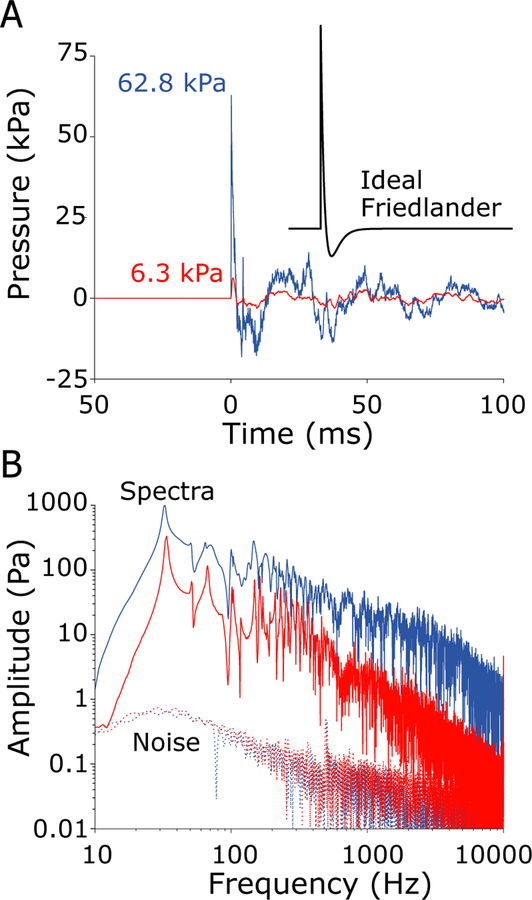
Fig. 4:
Example shock waves generated by the shock tube measured by the free-field pressure gauge during testing of specimen 359. A) Time-domain recordings show a 7 kPa nominal peak pressure (red; 6.3 kPa actual), and a 55 kPa nominal peak pressure (blue; 62.8 kPa actual) shock wave exposures. An ideal Friedlander waveform with a 2 ms A-duration is shown in the inset. B) The frequency spectra (solid) of the shock waves shown in A, along with the noise floors (dashed) estimated from the period preceding the exposure, reveal a high signal-to-noise ratio from ~10 Hz - 10 kHz that extends to a wider range of frequencies with increasing SPL. Spectra are computed over a 1 sec. window beginning at the onset in the free-field sensor.

