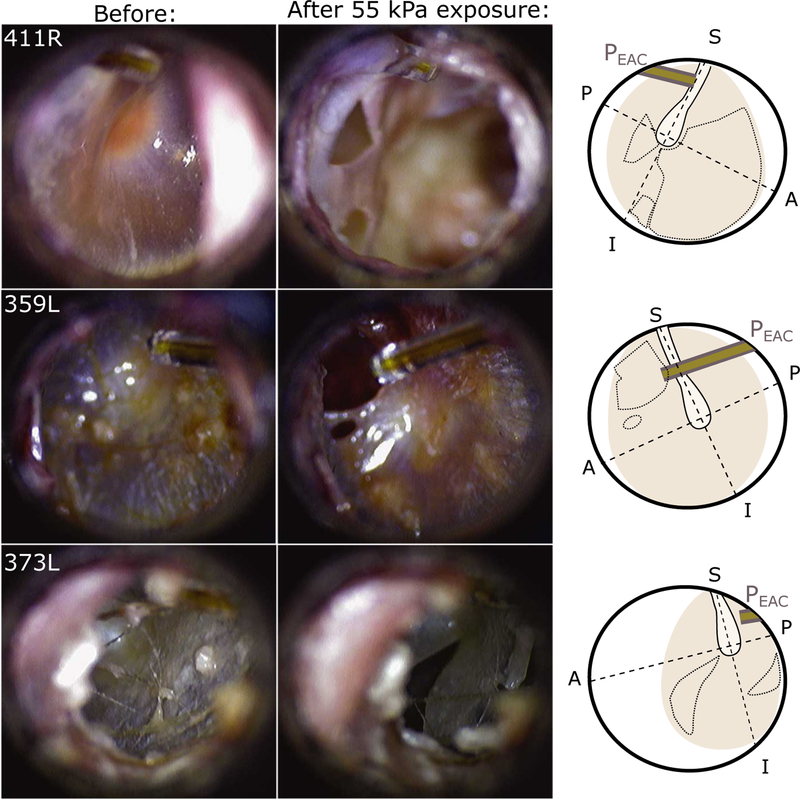
Fig. 5:
Photomicrographs of tympanic membranes taken before (left) and after (center) high level shock wave exposures from three specimens/ears (specimen number and ear (L or R) noted in the upper left of each panel). The external auditory canal fiber-optic pressure sensor (EAC) is visible in the upper left or right corners. The approximate position of the umbo, orientation of the manubrium (solid outline), and perforated area (dotted lines) is highlighted in an illustration (right) of each TM.

