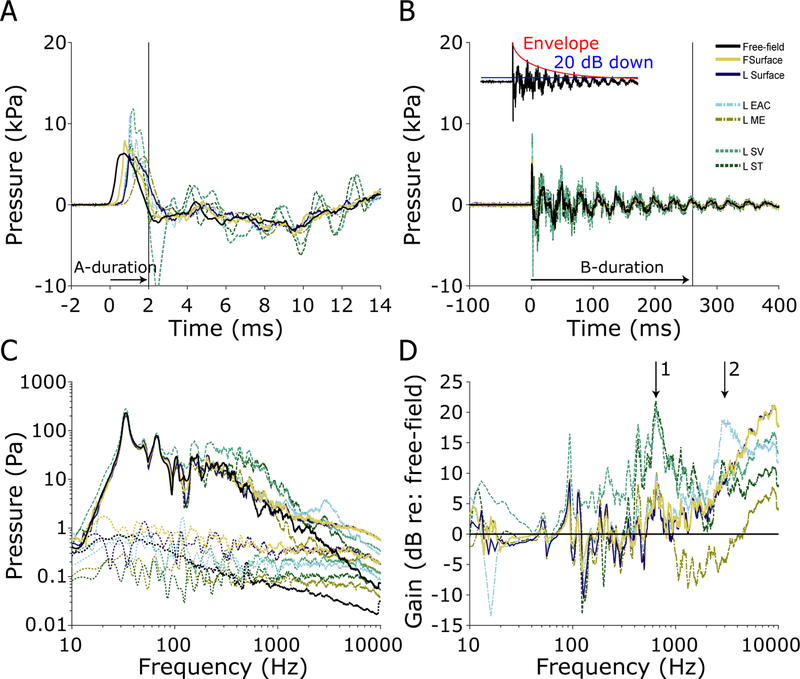
Fig. 6:
Pressures measured during a 7 kPa nominal peak pressure exposure in ear 359L. The first 14 ms (A), and 400 ms (B) of the recording are shown, illustrating the A- and B- durations (horizontal arrows) of the free-field pressure gauge measurement of the shock wave. For all sensors, A-duration (2.0 ms) is defined as the first zero crossing, while the B-duration (259.1 ms) is defined as the time to the last point exceeding 20 dB down from the peak (see inset). The frequency spectra (solid) and noise floors (dotted) of each sensor (C). The gain of each sensor relative to the free-field pressure gauge (D).

