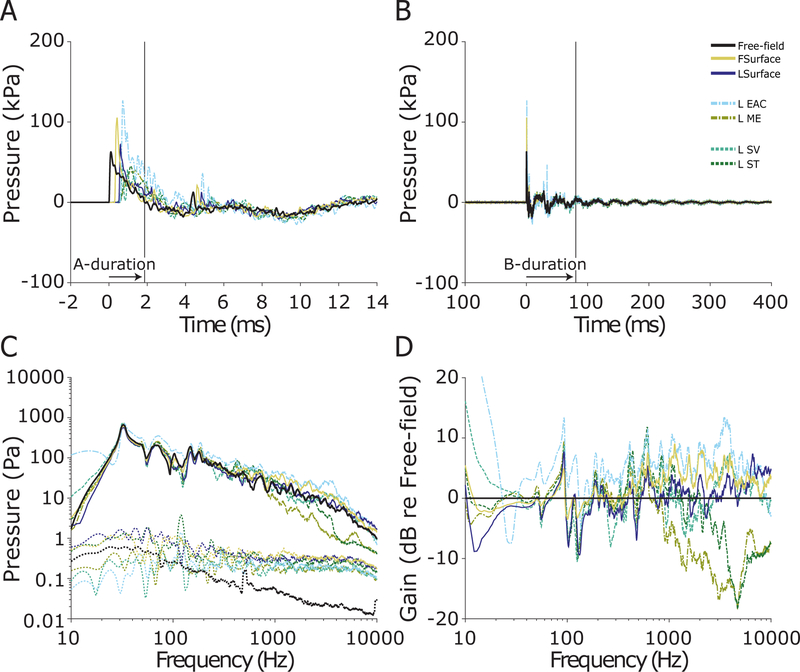
Fig. 8:
Pressures measured during a 55 kPa nominal peak pressure exposure in ear 359L (same as Figure 6). The first 14 ms (A), and 400 ms (B) of the recording are shown, illustrating the A- and B- durations (horizontal arrows; 3.1 & 62.4 ms respectively) of the free-field pressure gauge measurement of the shock wave. The frequency spectra (solid) and noise floors (dotted) of each sensor (C). The gain of each sensor relative to the free-field pressure gauge (D).

