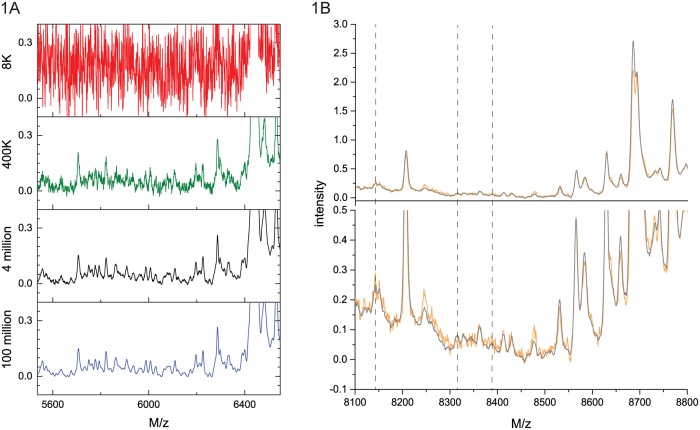
Fig 1. Dependence of average spectrum on the number of laser shots.
A) Processed spectra for the reference sample RS2 acquired on the SimulTOF100 are shown in the mass range from 5.53 kDa to 6.55 kDa for 8K, 400K, 4 million, and 100 million laser shots. B) Comparison of average spectra for the reference sample RS2 acquired on the SimulTOF100 in the m/z-range 8.1 to 8.8 kDa. Orange: 0.4 million laser shots, Black: 8 million laser shots. Top panel: The whole intensity range; Bottom panel: Enlarged to show low-intensity peaks. The dashed vertical lines indicate the m/z position of small peaks discussed in the text.

