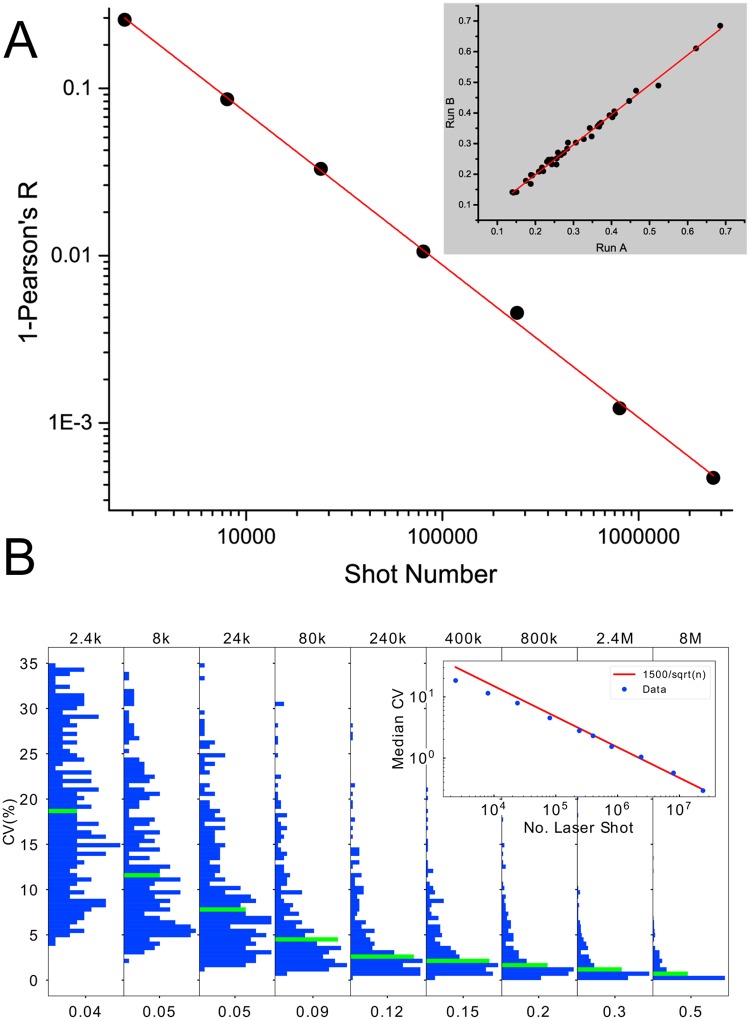
Fig 3. Reproducibility of feature values.
A) The median of (1-Pearson’s R) over all peaks, as a function of the number of shots for the MQS acquired on the SimulTOF100. The inset shows an example of the concordance analysis for the peak at 10236 Da for 240,000 shots. In the inset the horizontal axis relates to feature values from the set 1 of the MQS averages (Run A), and the vertical axis to feature values of MQS set 2 averages (Run B). B) The distributions of CVs of all features (peaks) for increasing numbers of laser shots of RS2. For each number of shots the median CV is highlighted. The horizontal axis for each panel is the relative frequency of values of CVs. The histograms are normalized as probability densities (area under the histogram is equal to 1). For each histogram, the value on the horizontal axis is a half of the maximum value of the histogram. The inset shows the median CV as a function of the number of shots with the red line indicating a behavior proportional to the inverse square root of the number of shots.

